ME-oil-supplies-as-Gaza-war-The Hamas attack on Israel on 7 Oct 2023 was reminiscent of the 1973 Yom Kippur war which triggered the 1st oil crisis (see Appendix) after OPEC imposed an oil embargo on the US and some Western countries for assisting Israel in that war. The embargo was successful because the US oil production had peaked in 1970. Although (unconventional, light) shale oil turned the situation for the US, many other countries have peaked in the meantime and now the global supply system is at peak.
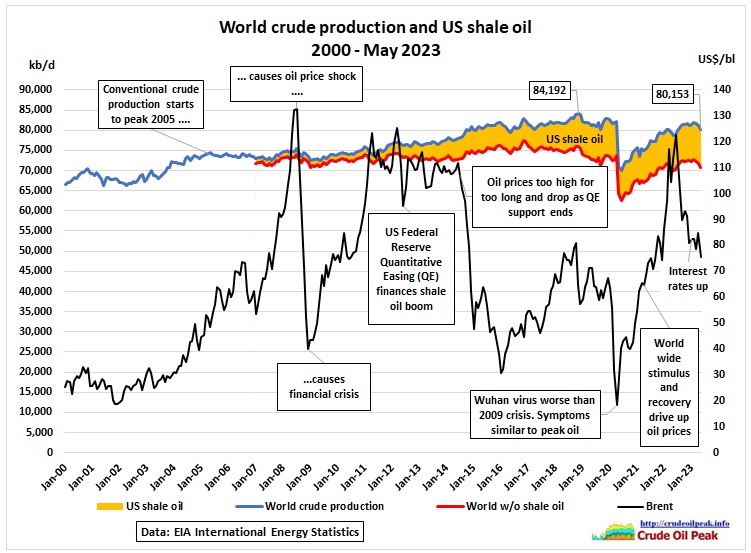 Fig 1: World crude production by May 2023
Iran called on Islamic countries to impose an oil embargo on Israel but the Gulf Cooperation Council (Saudi Arabia, the UAE, Kuwait, Qatar, Bahrain and Oman) said it will not use oil as a weapon. A tanker from Azerbaijan (via Ceyhan) carrying 1 mb of oil is reported by Bloomberg of being diverted to the Eilat harbour (Gulf of Aqaba), from where the oil will be pumped via the Ashkelon pipeline to the Paz refinery north of Ashdod.
https://oilprice.com/Latest-Energy-News/World-News/Israel-Said-To-Divert-Oil-Imports-To-Red-Sea-Port-To-Avoid-Targeting.html
US unveils new sanctions on Iran’s missile and drone programs as UN restrictions expire
18 Oct 2023
The Biden administration on Wednesday unveiled new sanctions targeting Iran’s ballistic missile and drone programs as the United States and dozens of other partners vowed to continue to counter those programs as a set of United Nations restrictions expired.
In light of this, countries like Germany, France, and the United Kingdom – known as the E3 – and the US have said they will maintain similar constraints on Iran’s missile program through their own national sanctions, despite the expiration of the UN restrictions.
https://edition.cnn.com/2023/10/18/politics/us-sanctions-iran-jcpoa-transition-day/index.html
U.S. Destroyer Used SM-2s to Down 3 Land Attack Missiles Launched from Yemen, Says Pentagon
19 Oct 2023
USS Carney (DDG-64) “shot down” the three missiles and a number of drones from Houthi-controlled territory in Yemen, according to Pentagon officials.
The west coast of Yemen is more than 1,000 miles from the southernmost tip of Israel – the outer range limit of most land attack cruise missiles.
The Houthis do have evolving long-range strike capabilities, such as the Quds series of land attack cruise missiles supplied by Iran, Ben Taleblu said.
“Some of these systems can reach southern Israel, like Eilat for example, when fired from Houthi-controlled territory in northern Yemen,” he said.
https://news.usni.org/2023/10/19/u-s-destroyer-used-sm-2s-to-down-3-land-attack-missiles-launched-from-yemen-says-pentagon
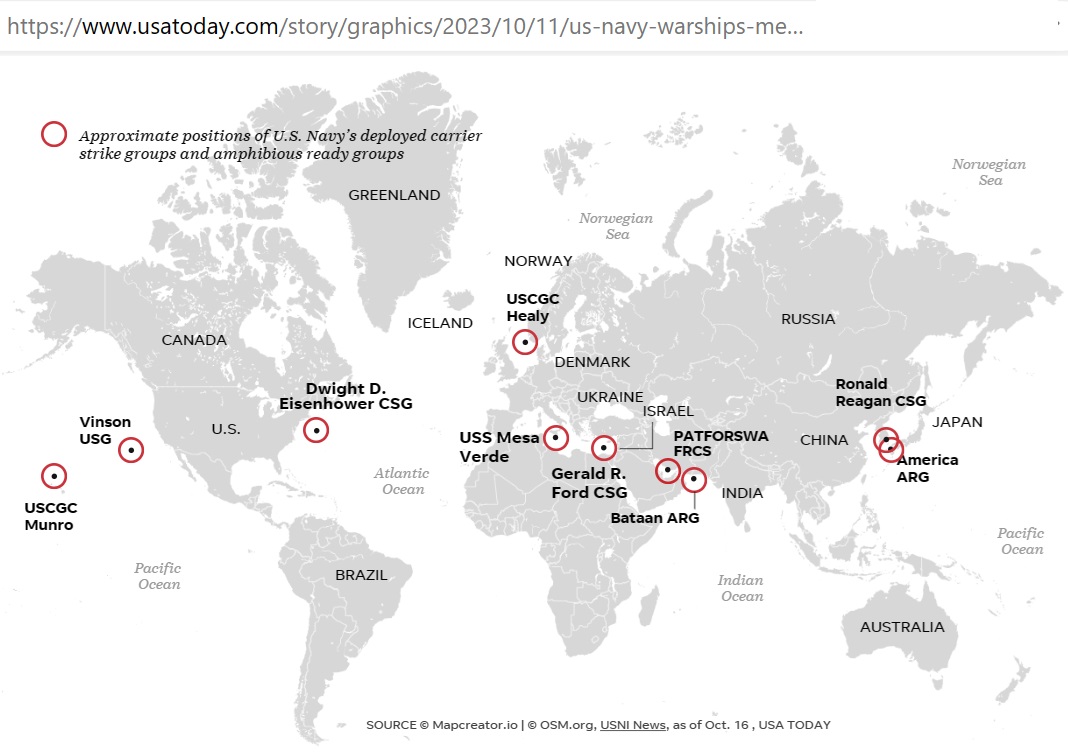 Fig 2: Position of US carrier strike groups 16 Oct 2023
https://news.usni.org/category/fleet-tracker
China Now Has Six Warships in the Middle East: Reports
23 Oct 23
The China’s People’s Liberation Army (CPLA) reported engagement in a joint military exercise with the Omani navy while visiting Oman earlier this week, and then moved to Kuwait to spend a “five-day goodwill visit.”
https://www.msn.com/en-us/news/world/china-now-has-six-warships-in-the-middle-east-reports/ar-AA1iFf6N
How does the oil supply situation look like?
Iran
Peak oil production in the 70s collapsed when the Shah regime was toppled in the 1979 Iranian revolution. In Sep 1980, Saddam attacked Iran, followed in 1984-1988 by a tanker war in the Persian Gulf. In 1995, Clinton issues executive orders preventing US companies to invest in the Iranian oil and gas sector. But over the next 20 years, oil production slowly recovered, interrupted by the impact of the 2003 Iraq war. After 2012 oil production was highly volatile due to the imposition of various sanctions with the aim to curb Iran’s development of nuclear weapons.
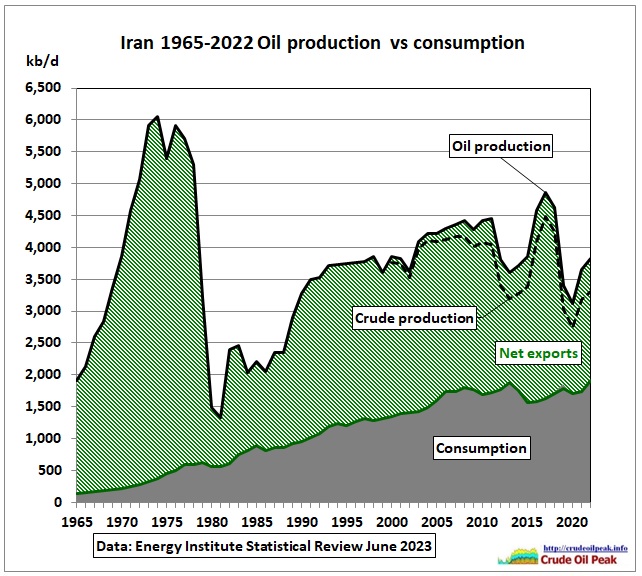 Fig 3: Iran oil/crude production and consumption (BP data)
In the BP/EI statistics, oil contains liquids from gas fields (which increased over the last 20 years). Note the rising oil demand until 2013.
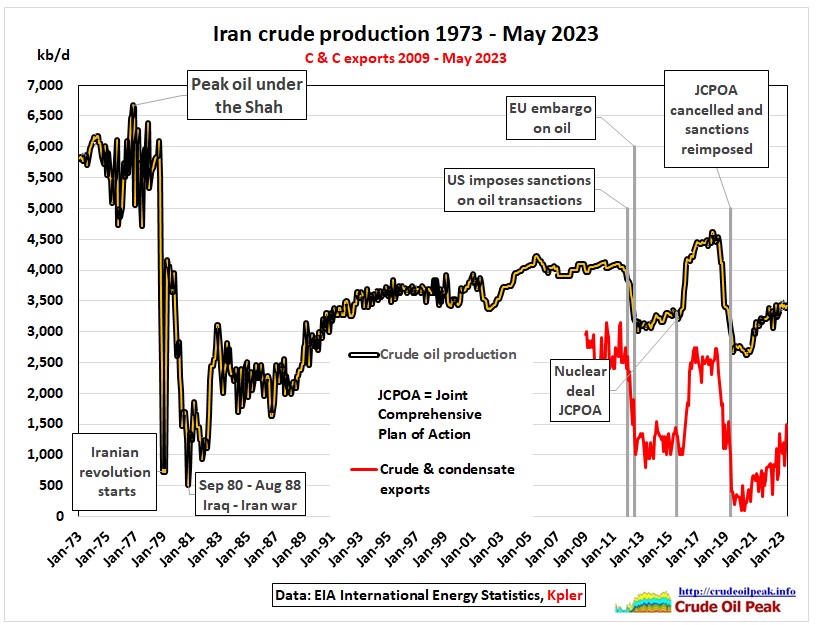 Fig 4: Iran crude production history since 1st oil crisis (EIA, Kpler data)
Data on Iran’s oil exports are very unreliable. They differ from source to source, mainly because of problems with tracking the tankers involved in the Iranian oil trade. Some data also contain condensate.
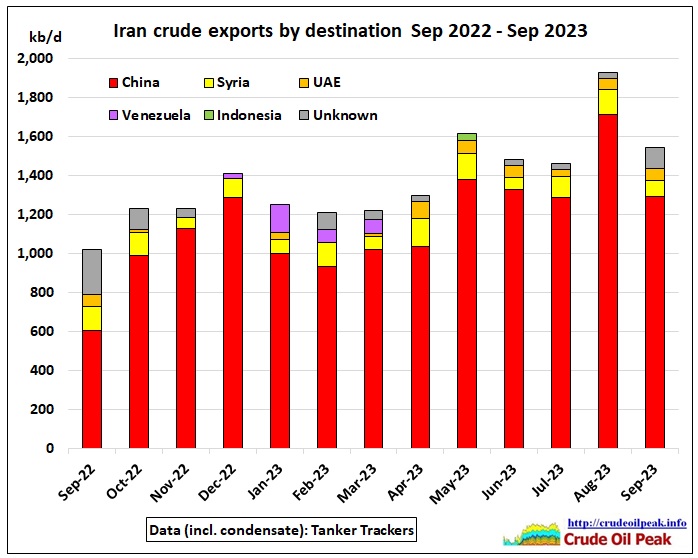 Fig 5: Most of the Iranian oil exports end up in China
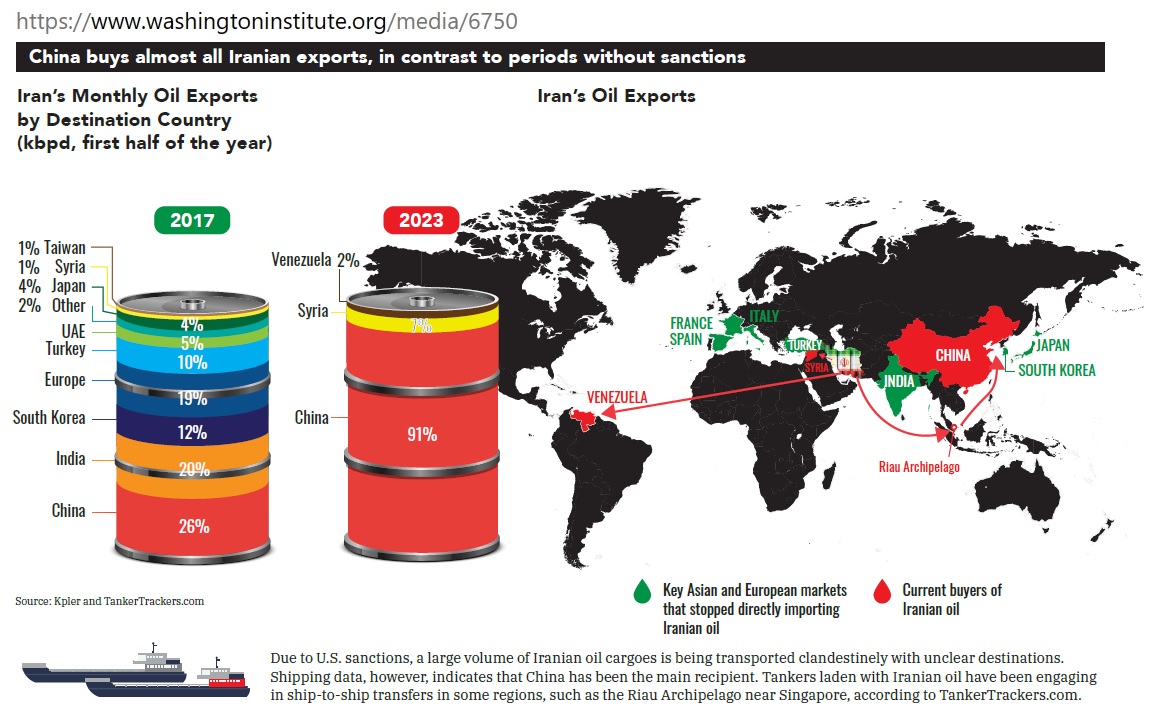 Fig 6: Iranian condensate is exported to Venezuela as diluent for the heavy Orinoco oil
At an IMF annual meeting in Marrakech US Treasury Secretary Janet Yellen said:
11 Oct 2023
“We have not in any way relaxed our sanctions on Iranian oil,” she said, adding the US constantly reviews new information that could justify a tightening of sanctions. “We will continue to do that.”
https://time.com/6322547/yellen-us-iran-sanctions/
The Tanker Trackers commented: “Janet Yellen is right. The US hasn’t relaxed sanctions, but hasn’t enforced them much either. E.g., only 1/4th of the world’s +600 tanker Dark Fleet is blacklisted by US Treasury OFAC and much of that is just Iran’s own tankers. The Dark Fleet continues to grow”
https://twitter.com/TankerTrackers/status/1712039199338041524
Stop the Hop II: The Ghost Armada Grows
29 Sep 2023
![]() Fig 7: The Ghost Fleet
Fig 7: The Ghost Fleet
https://www.unitedagainstnucleariran.com/blog/stop-hop-ii-ghost-armada-grows
Office of Foreign Asset Control – Iran sanctions
https://ofac.treasury.gov/sanctions-programs-and-country-information/iran-sanctions
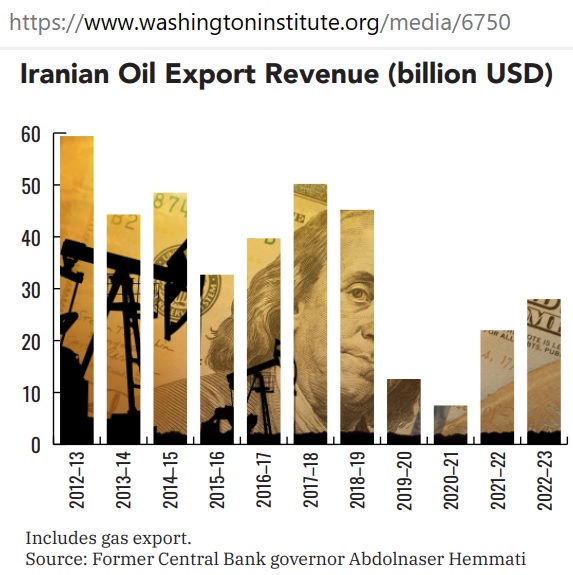 Fig 8: Iran’s oil export revenue
https://www.washingtoninstitute.org/media/6750
Iran’s central bank chief dismissed for running for President
30 May 2021
Tehran, Iran – President Hassan Rouhani has dismissed Iran’s central bank chief, Abdolnasser Hemmati, for becoming a presidential candidate in the June 18 election.
https://www.aljazeera.com/news/2021/5/30/irans-central-bank-chief-dismissed-for-running-for-president
Iran opens oil terminal to bypass strategic Strait of Hormuz
July 2021
The new terminal is located near Jask port on the Gulf of Oman, just south of the Strait of Hormuz, allowing ships headed into the Arabian Sea and beyond to avoid the narrow route. Iran’s main oil export terminal is located at the port of Kharg inside the Strait of Hormuz, a waterway less than 40 kilometres (25 miles) across at its narrowest point.
Rouhani said Iran aimed to export one million barrels per day (bpd) of oil from the new facility. At the moment, the project allows 350,000 barrels to be exported per day.
https://www.aljazeera.com/news/2021/7/22/iran-opens-oil-terminal-to-bypass-strategic-strait-of-hormuz
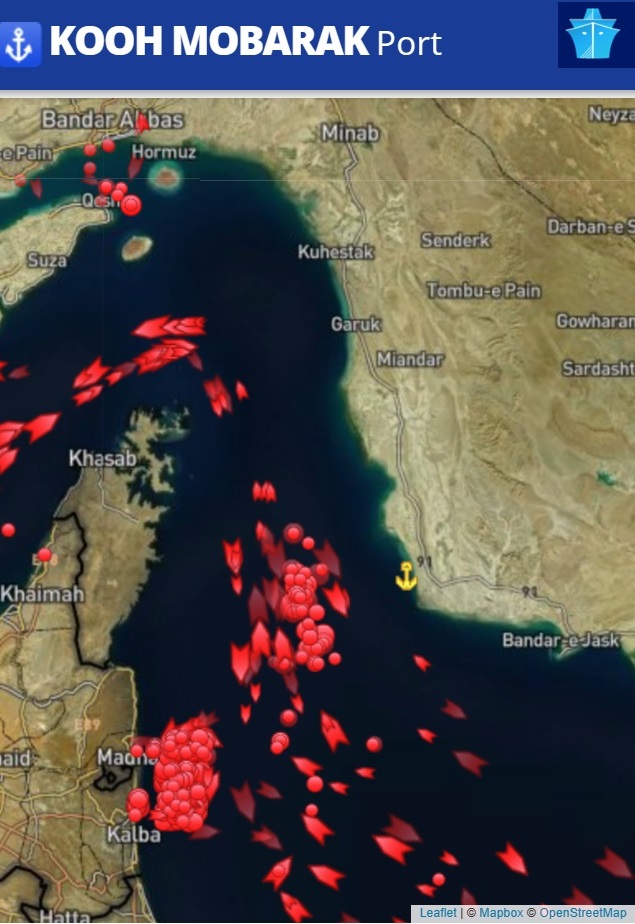 Fig 9: Iranian port of Kooh Mobarak south of Hormuz. The oil terminal (anker symbol) is 65 km north west of Bandar-e-Jask
Marinetraffic does not show any tankers there (Automatic Identification System – AIS turned off).
More technical details (from 2021) are available from the Tanker Trackers
https://tankertrackers.com/articles/iran-s-new-oil-terminal
The location is known for this incident:
Iran Shot Down a $176 Million U.S. Drone
21 June 2019
https://time.com/5611222/rq-4-global-hawk-iran-shot-down/
Saudi Arabia
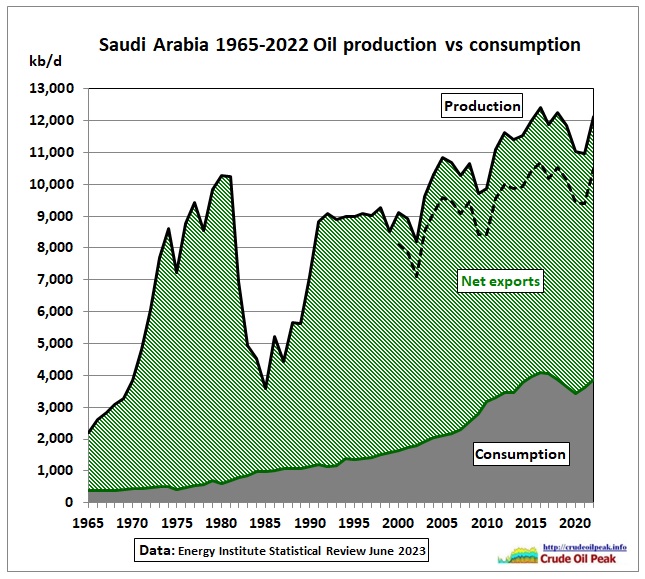 Fig 10: Saudi Arabia’s oil/crude production, consumption (BP data) and implies net exports
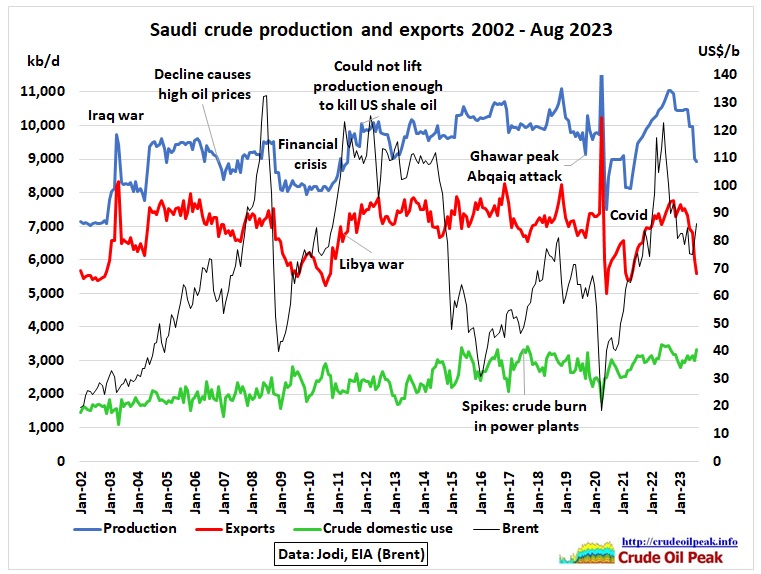 Fig 11: Saudi crude production and exports
Domestic use of crude increases in power plants during summer. “Direct crude oil burn from July through September 2020 averaged 654,000 b/d, up from 545,000 b/d during the same time in 2019”.
https://www.eia.gov/international/content/analysis/countries_long/Saudi_Arabia/saudi_arabia.pdf
More details are here:
30/10/2018 Saudi Update October 2018
http://crudeoilpeak.info/saudi-update-october-2018
Since the conventional crude oil peak in 2005, Saudi exports have mostly been fluctuating between 7 mb/d and 8 mb/d. The dip in 2007 below 7 mb/d caused high oil prices and the US recession which contributed to the financial crisis in 2009 lowering global oil demand and its growth trend by 2-3 mb/d. Between 2012 and 2019, average exports were 7.3 mb/d.
It is generally assumed that Saudi Arabia can ramp up oil production (to 12 mb/d?) to fill any gaps in oil supplies.
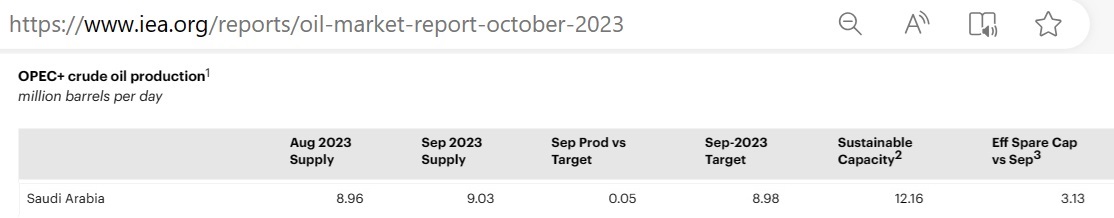 Fig 12: Excerpt from the IEA Oil Market Report October 2023
https://www.iea.org/reports/oil-market-report-october-2023
This includes half of the Neutral Zone capacity (160 kb/d).
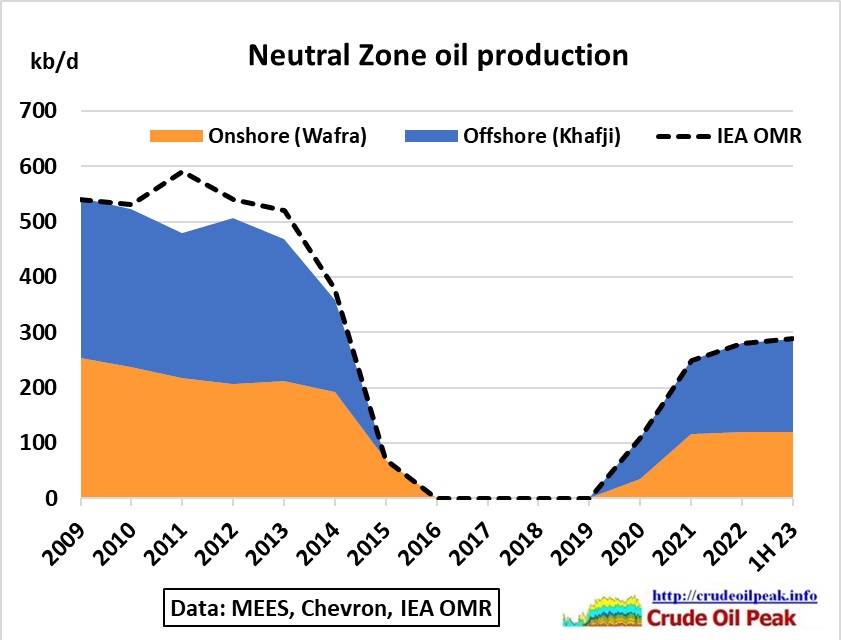 Fig 13: Oil production in Neutral Zone shared 50/50 by Kuwait and Saudi Arabia
The history of the NZ is complex. The causes of the disruption between 2015-2019 are described in this article:
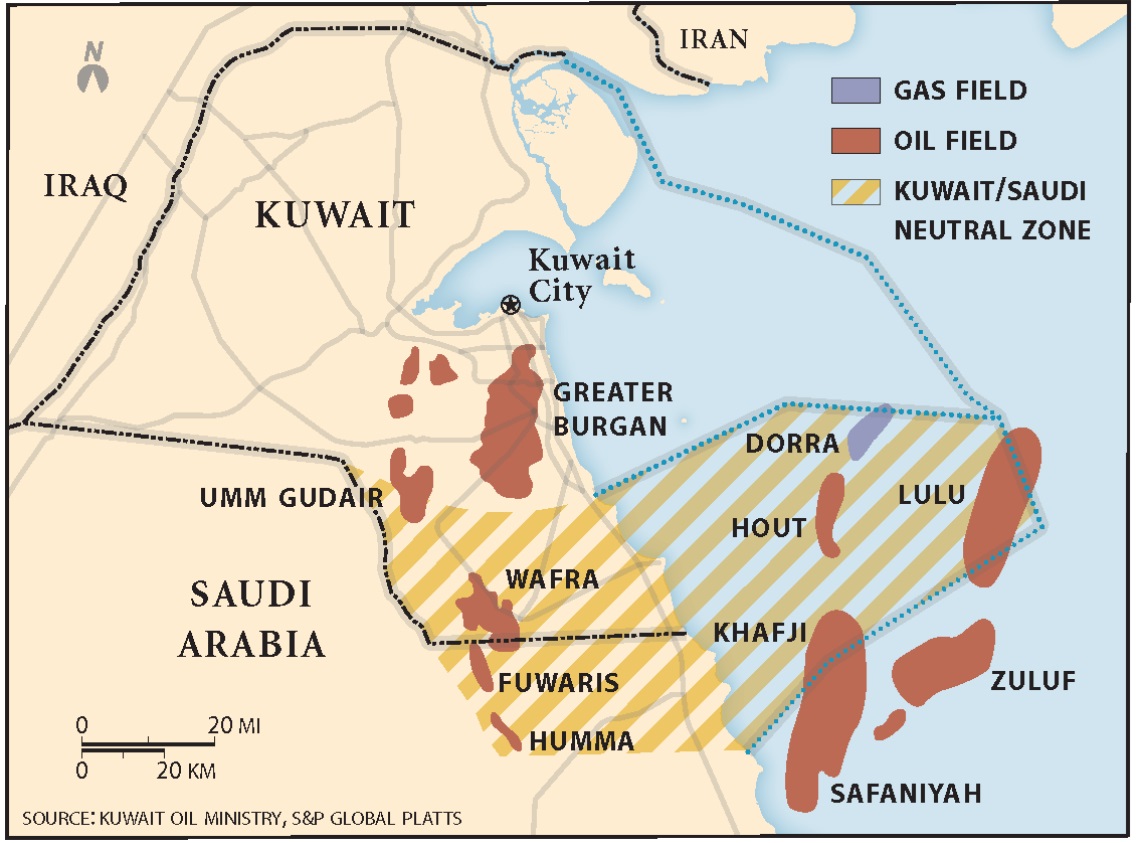 Fig 14: Map with oil fields
Kuwait has had some differences in recent years with its Gulf neighbours, taking a more vocal stand in favour of the Palestinian cause, playing only a minor role in Yemen, and being more dovish on Iran. Now, assuming parliamentary approval follows, Saudi Arabia and Kuwait have seemingly managed to close one, albeit small, regional rift.
https://agsiw.org/protracted-negotiations-yield-solution-to-saudi-kuwaiti-neutral-zone-dispute/
The future of onshore Wafra depends on heavy oil which needs energy intensive steam flooding (by Chevron). Note that Kuwait is a net importer of gas (from Qatar) with an LNG terminal at Al Zour.
Which statistical evidence of past production can be found to support an assumption of 12 mb/d?
In the Nov 2020 bond base prospectus (seen by many financial planners and economists including of course the underwriters Citi, Goldman Sachs International, HSBC, JP Morgan, Morgan Stanley and NCB Capital) it says:
Global Medium Term Note Programme
16 Nov 2020
“In the nine months ended 30 September 2020, Saudi Aramco produced on average 12.4 million barrels per day of oil equivalent, including 9.2 million barrels per day of crude oil (including blended condensate and AGOC’s share [Aramco Gulf Operations Company] of the partitioned territory and its adjoining offshore areas in accordance with the agreements between the Kingdom and the State of Kuwait). Saudi Aramco reached a record level of production of 12.1 million barrels per day of crude oil on 2 April 2020 and 10.7 billion standard cubic feet per day of natural gas on 6 August 2020”
Pursuant to an agreement between the Kingdom and the Kingdom of Bahrain .. the Kingdom of Bahrain is entitled to 50% of the net income derived from crude oil produced from Abu Sa’fah. The amount of crude oil produced from Abu Sa’fah and delivered to the Kingdom of Bahrain was 153 mbpd, 152 mbpd and 152 mbpd in 2017, 2018 and 2019, respectively.
Saudi Aramco’s MSC includes 100% of the crude oil volumes produced from Abu Sa’fah, but its production volumes do not include the crude oil produced from Abu Sa’fah and delivered to the Kingdom of Bahrain.
https://www.aramco.com/-/media/publications/corporate-reports/bonds/saudi-aramco-bond-base-prospectus-2020.pdf
From here: https://www.aramco.com/en/investors/investor-tools/bond-information
“Oil equivalent” means that the energy in gas has been converted to equivalent barrels of oil (boe) and added to crude oil. So these are not really liquids.
Saudi Aramco’s annual report 2020 has the details (with similar data for 2021):
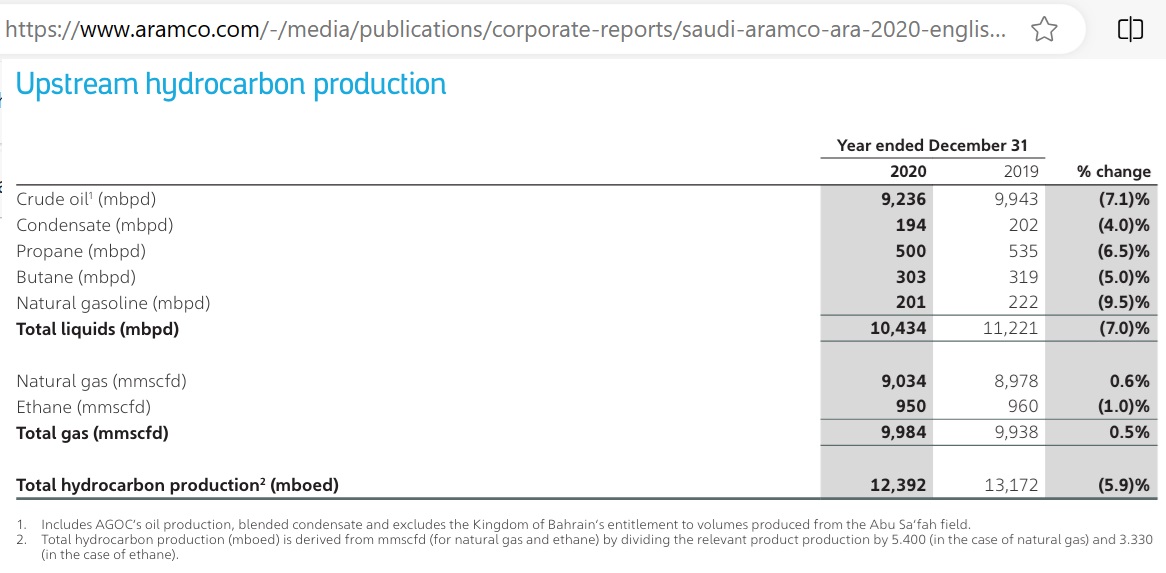 Fig 15: Saudi Aramco’s liquids and “relevant” natural gas and ethane production in boe
https://www.aramco.com/-/media/publications/corporate-reports/saudi-aramco-ara-2020-english.pdf
These 12.4 mboe/d include oil from the Neutral Zone (only 50% of 110 kb/d in 2020, and 50% of 250 kb/d in 2021) but exclude Bahrain’s share of Abu Sa’fah (50% of 300 kb/d which is at peak level and set to decline https://www.offshore-technology.com/data-insights/oil-gas-field-profile-abu-safah-conventional-oil-field-saudi-arabia/?cf-view )
Let’s have a look at the year 2020 month by month. We can see that 12.1 mb/d of crude oil were only achieved in one month, April 2020. After that the Wuhan virus hit and later production is difficult to compare.
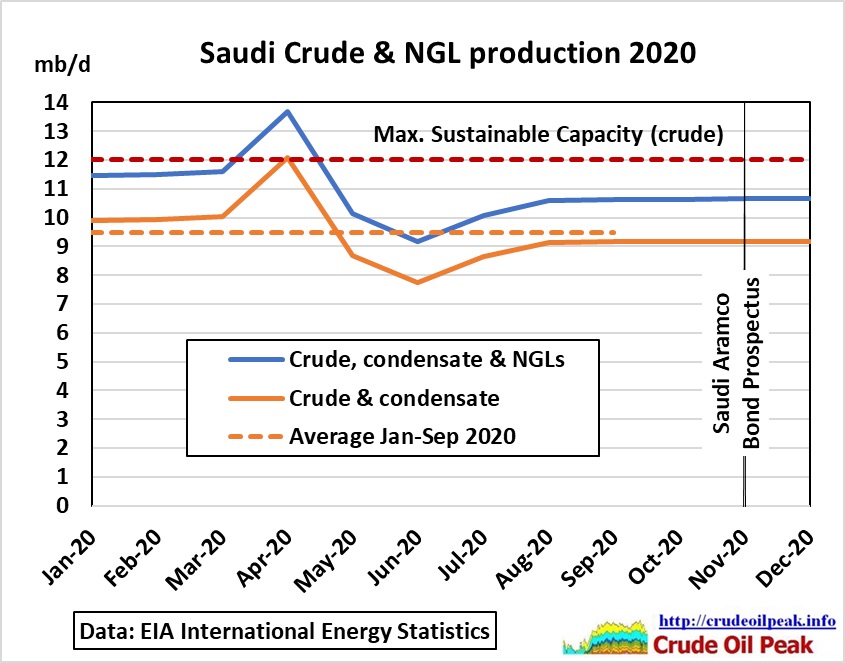 Fig 16: Saudi crude, condensate & NGL production in 2020 compared to MSC
“Maximum Sustainable Capacity – the average maximum number of barrels per day of crude oil that can be produced for one year during any future planning period, after taking into account all
planned capital expenditures and maintenance, repair and operating costs, and after being given three months to make operational adjustments. The MSC excludes AGOC’s crude oil production capacity.” [AGOC Aramco Gulf Operations Company Ltd.]
https://europe.aramco.com/-/media/publications/corporate-reports/saudi-aramco-h1-2022-interim-report-english.pdf
Saudi expects 13 million bpd oil capacity by 2027: Minister
16 May 2022
Energy giant Saudi Aramco announced in March 2020 it had been directed by the energy ministry to increase its maximum sustainable capacity from 12 million to 13 million bpd.
Manama: Saudi Arabia expects to ramp up its daily oil production capacity by more than one million barrels to exceed 13 million barrels by early 2027, the kingdom’s energy minister announced Monday.
https://auto.economictimes.indiatimes.com/news/oil-and-lubes/saudi-expects-13-million-bpd-oil-capacity-by-2027-minister/91601068
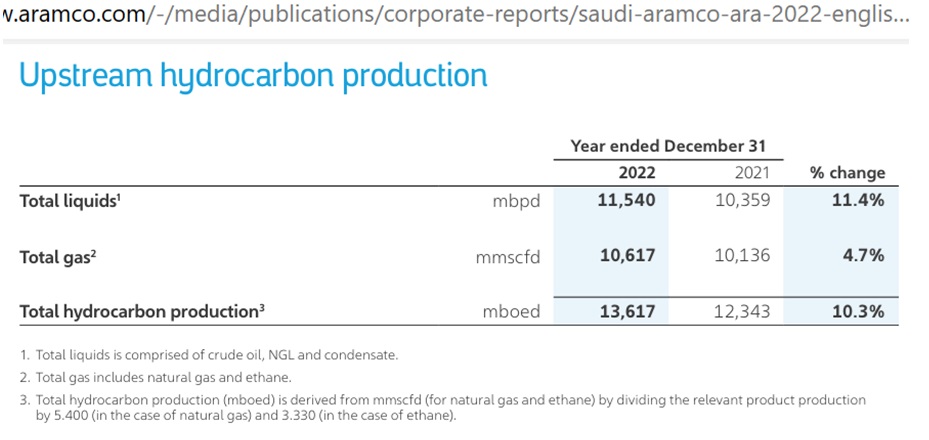 Fig 17: The Aramco annual report does not give crude oil production, only total liquids
Using NGL data from 2021 we can estimate that crude production in 2022 was 11,540 – 1,140 = 10,400 kb/d
OPEC quotas
Let’s update the Saudi graph shown in this post;
11/12/2022 OPEC 10 crude production and quotas during Covid
http://crudeoilpeak.info/opec-10-crude-production-and-quotas-during-covid
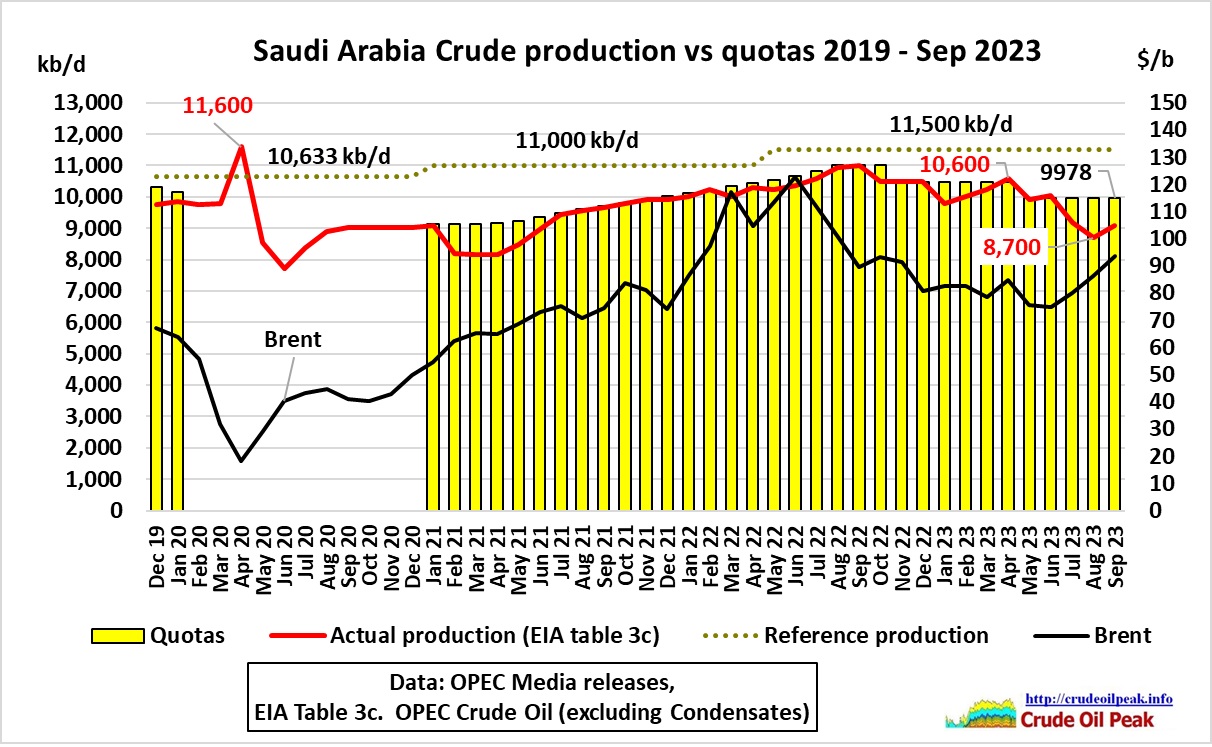 Fig 18: Saudi crude production vs OPEC quotas
OPEC’s quotas (“required production”) are published in PDF files attached to press releases of the Joint Ministerial Monitoring Committee (JMMC) or Ministerial meetings
https://www.opec.org/opec_web/en/press_room/28.htm
The actual production data are a bit lower than in Fig 16 because EIA’s table 3a does not include condensate. We can see that OPEC’s quotas never allowed Saudi Arabia to reach 12 mb/d with the exception of April 2020. Therefore, the MSC remains untested.
To be continued
Appendix A
Yom Kippur War which started on 6 Oct 1973 https://en.wikipedia.org/wiki/Yom_Kippur_War
The Israeli government knew about the Syrian and Egyptian preparations for war. On 25 Sep 1973 King Hussein of Jordan warned Prime Minister Golda Meir of an impending attack. But this was ignored and Mossad thought the Arabs were not capable of war. Only 2 days before the war started aerial photography and other signs showed that Syrians and Egyptians had amassed troops at the Golan Heights and the Suez Canal under the guise of a military drill. Nixon (who was pre-occupied with the Watergate Affair) and Kissinger(new to the job of Secretary of Sate) had warned Meir that Israel should not attempt a pre-emptive strike. That allowed the US to start airlifting military equipment on 14 Oct 1973 in support of Israel. Russia was on the Arab side and did the same but Brezhnev was disappointed that the superiority of Soviet supplied weaponry did not lead to a victory.
The war ended on Oct 25th 1973 after a cease fire with following territorial gains and losses: on the Syrian front the Golan Heights overlooking the Jordan valley were retaken after lost in the first days of the war. Then Israel had made some advances towards Damaskus. Along the Suez Canal, the Egyptians had taken a strip of land on the east side while Israel had occupied an area on the west side. The Gaza strip, which Israel had taken from Egypt in the 6-day war In 1967, remained under Israeli control.
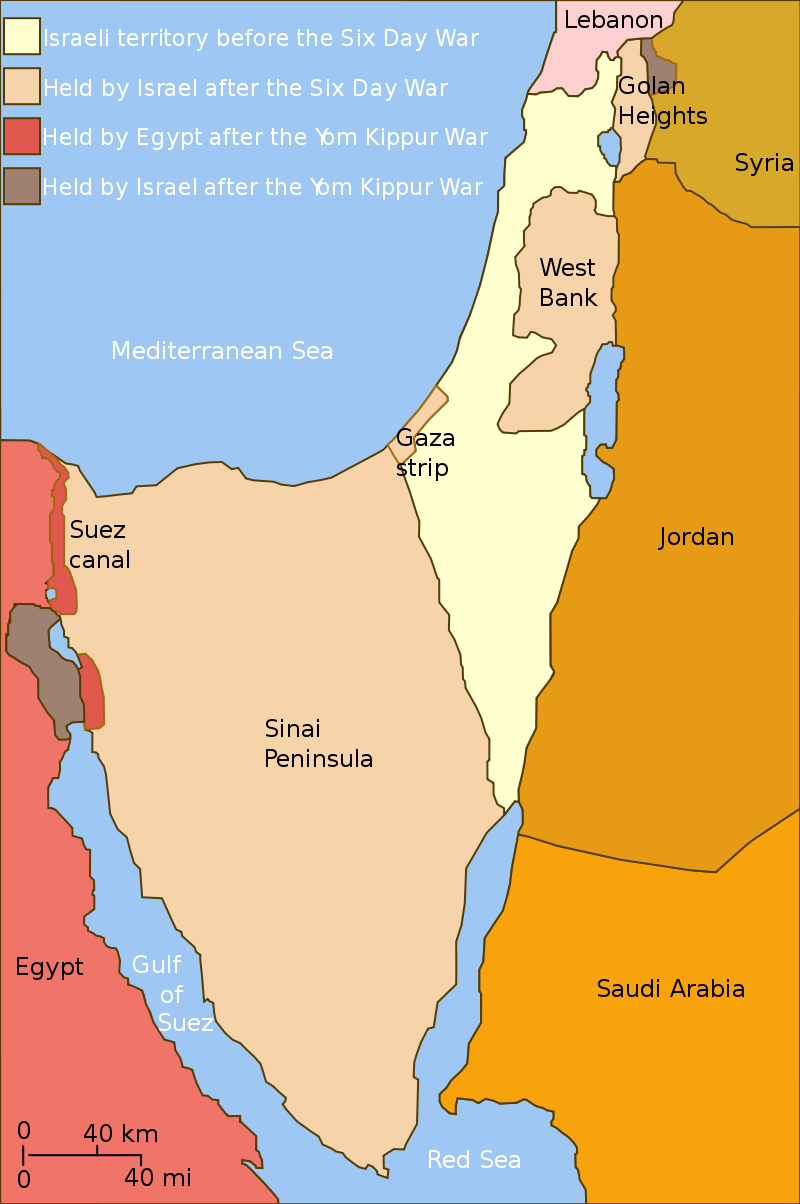 Fig 19: Map at Yom Kippur War ceasefire
In response to U.S. support of Israel, the Arab members of OPEC, led by King Faisal of Saudi Arabia, decided to reduce oil production by 5% per month on 17 October. On 19 October, President Nixon authorized a major allocation of arms supplies and $2.2 billion in appropriations for Israel. In response, Saudi Arabia declared an embargo against the United States, later joined by other oil exporters and extended against the Netherlands and other countries, causing the 1st oil crisis. Oil prices increased from $3/barrel to $12/barrel ($20/b to $60/b in today’s prices adjusted for inflation).
 Fig 20: Petrol queue on Bayview Rd in Earlwood, Sydney
 Fig 21: It was mainly Saudi Arabia which cut production in October 1973
Iran was at maximum production (see Fig 3)
“Iran and the U.S. were allies. Under the Shah, Mohammad Reza Pahlavi, Iran kept on producing and exporting throughout the six-month embargo that lasted until March 1974.” https://www.npr.org/sections/parallels/2013/10/15/234771573/the-1973-arab-oil-embargo-the-old-rules-no-longer-apply
Appendix B
On Saudi Aramco’s 2020 prospectus
There were 4 tranches for a total of US$ 8 bn with following coupon rates: 2025 notes (1.625%), 2030 notes (2.25%), 2050 (3.25%) and 2070 (3.5%)
This is the performance of the 2030 notes:
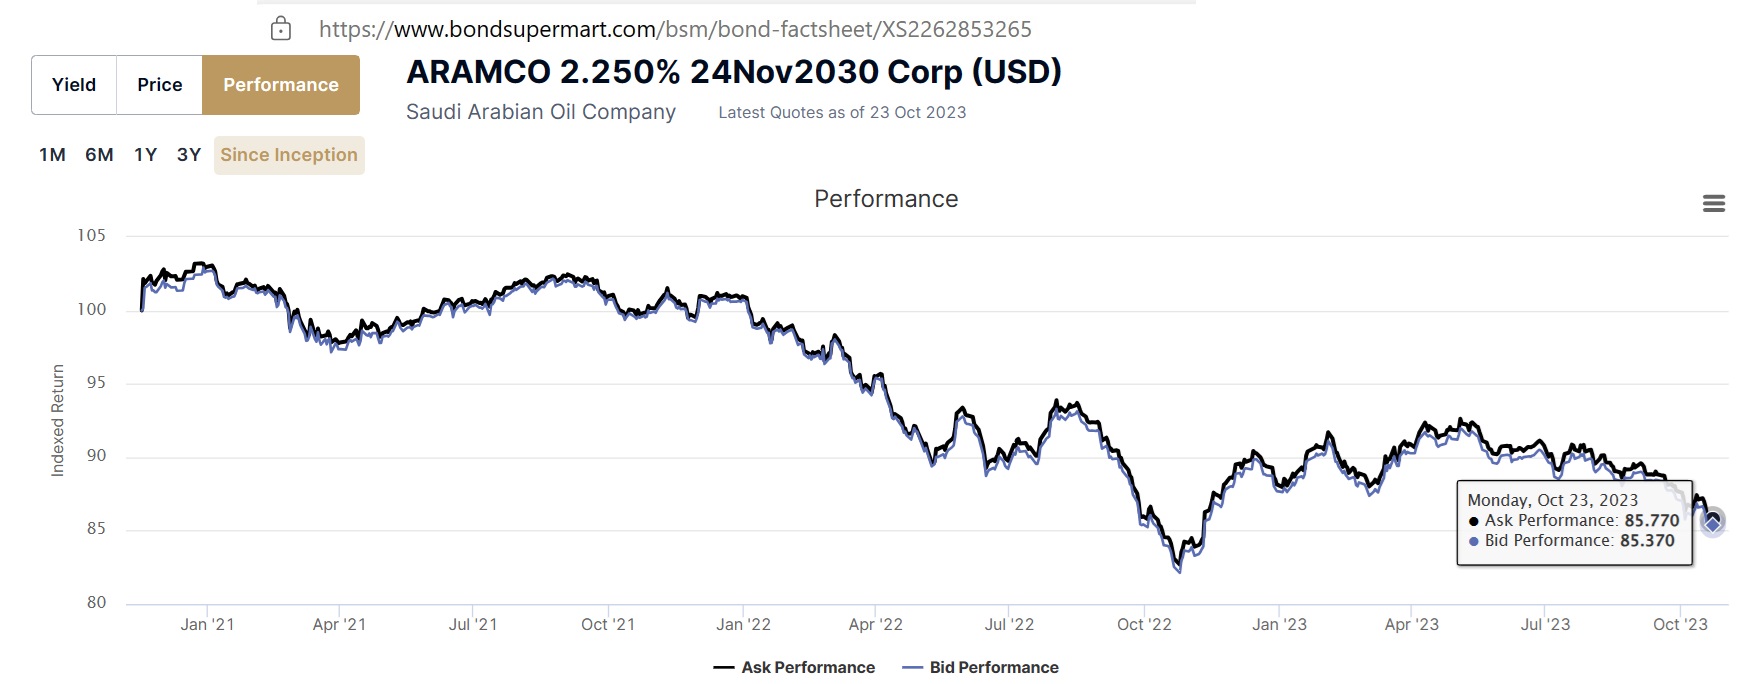
Fig 22: The bid performance was 85%
https://www.bondsupermart.com/bsm/bond-factsheet/XS2262853265
To be continued with other ME countries
Related links