Part 2 Eraring, Mt Piper, Vales Pt
Introduction: The NSW government is selling Snowy Hydro to the Federal Government, thereby demonstrating beyond doubt that it is abrogating its duty of care to transition the energy supply system away from coal to renewable energies.
Malcolm Turnbull buys Snowy Hydro scheme from NSW and Victoria for $6 billion
1/3/2018
While the proceeds must be spent on “productive infrastructure” that boosts the economy, there will be no conditions placed on the specific projects that are funded by the proceeds, leaving Victorian Premier Daniel Andrews and NSW Premier Gladys Berejiklian with full scope to fast-track existing projects with the help of the new cash.
NSW will receive $4.154 billion and Victoria will get $2.077 billion, reflecting their respective Snowy shareholdings after allowing for the company’s debt.
It is feared $4 bn will be wasted in election gifts. The Federal government failed to impose as a condition of sale that NSW spends the proceeds on investments in e.g. windfarms to drive the Snowy2 pumps.
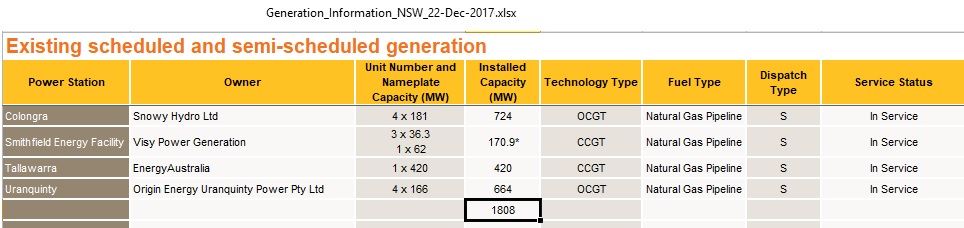 Fig 1: NSW black coal generation capacities
Eraring
Nameplate capacity 4×720=2,880 MW
 Fig 2: Eraring coal fired power plant
Available generation for each of the 4 units was 700 MW max, slightly less than the name plate capacity of 720 MW.
Unit 1 started only on Jan 4th 2018.
 Fig 3: 3-dimensional representation of utilization of available generation between 4 Jan 2018 and 29 Jan 2018 in the afternoon (yellow to red) and evening (yellow to green). The valleys show a malfunction of the power unit.
 Fig 4: Drop in generation on 24 Jan to less than half of rated capacity between 2 normal operating days
 Fig 5: Note that when available and metered generation drop together the utilization rate can still be high, but at a lower generation level.
Mt Piper
Nameplate capacity 2 x 660 MW = 1,320 MW
 Fig 6: Source of coal: Springvale mine
 Fig 7: Mt piper unit 1: available generation not stable
 Fig 8: Mt Piper unit 1: high utilization can’t be maintained
The duration of the generation peaks increases in the first 4 days, then the available generation drops in day 5, right in the afternoon hours.
 Fig 9: Mt Piper unit 2: availability above 300-400 MW not guaranteed
Vales Point
Nameplate capacity 2 x 660=1,320 MW
 Fig 10: Vales Point Power Station
 Fig 11: Vales Point unit 5
 Fig 12: Vales Point unit 6
Summary graphs
 Fig 13: Bayswater comparison metered, available generation vs nameplate capacity
 Fig 14: Liddell comparison metered, available generation vs nameplate capacity
 Fig 15: Eraring comparison metered, available generation vs nameplate capacity
 Fig 16: Mt Piper, Vales Pt. comparison metered, available generation vs nameplate capacity
Summary
During the critical afternoon hours, total available generation was 8,700 MW or 86% of name plate capacity out of which 5,800 MW was at 95% of name plate capacity. 2,900 MW was running at 81% of name plate capacity
Metered generation was 8,200 MW or 94% of available generation out of which 3,600 MW were running at 95% or higher.
Except for repairing, putting back in service and maintaining Liddell unit 2 there is very little room for the current system to generate more. After the closure of Liddell in 2022 it is another ball game altogether. As mentioned in part 1 of this post AGL has plans to replace Liddell with “a mix of high-efficiency gas peakers, renewables, battery storage and demand response, coupled with an efficiency upgrade at Bayswater Power Station and conversion of generators at Liddell into synchronous condensers”
The NSW government’s planning for a demand response [load shedding] is not what you would think.
Demand peaks
Clearly, coal fired power plants are struggling to supply during peak hours in hot summers. So what does the NSW government do? Apart from pulling out from Snowy’s hydro power it adds more peaky demand by promoting and approving entire new skyscraper cities like the Parramatta CBD.
 Fig 17: Parramatta “vision” http://www.investparramatta.com.au/invest-and-build
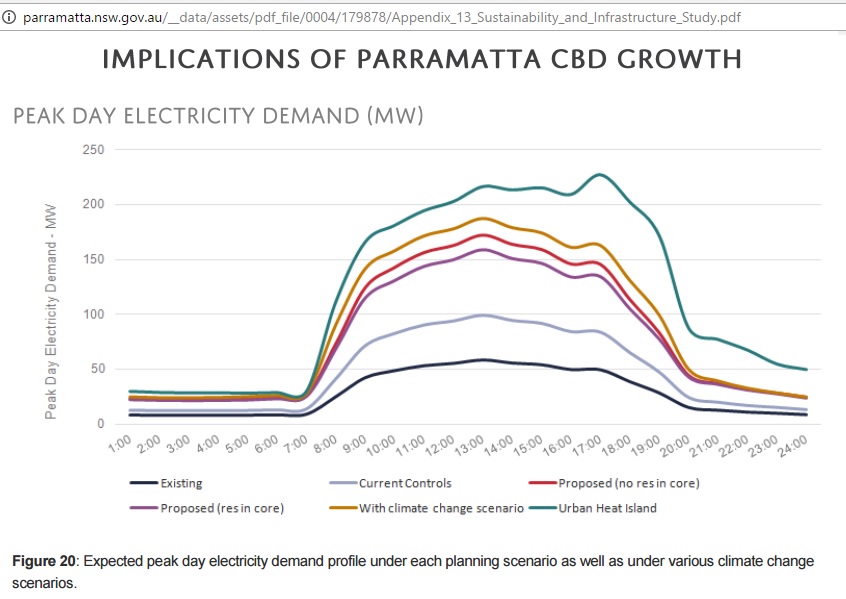 Fig 18: Parramatta Council calculated additional peak demand from CBD growth
Conclusion
The energy illiteracy and contradictions in planning are only too obvious. The NSW government is doing exactly the opposite of what it should do, namely to invest in renewable energy and to curb current power demand. It should also ask the Federal government to reduce immigration because a growing population is on a collision course with limited energy supplies including, of course, oil and liquid fuels.
Related posts:
14/3/2018
NSW coal power maxed out in hot summer (part 1)
https://crudeoilpeak.info/nsw-coal-power-maxed-out-in-hot-summer-part-1
11/3/2018
Australia’s east coast solar generation is replacing coal by only 2% in late summer
https://crudeoilpeak.info/australias-east-coast-solar-generation-is-replacing-coal-by-only-2-in-late-summer