This is the continuation of part 1
https://crudeoilpeak.info/nsw-power-generation-curves-lack-of-reserves-and-intervention-notices-september-2025-part1
Sample generation graphs from NEM
 Fig 15: High use of coal in cool spring night with little wind
On 12-13 September (Fri-Sat) coal plants were running at 6,100 MW (see also Fig 4) flat through the whole night (98% of available capacity), temperature 10.5 degrees in the morning. To show this more clearly, imports and loads were excluded in Fig 15. Unfortunately, the NEM software does not allow to change the order of stacking.
Wind decreasing during the night. Modest contributions from hydro and gas. Batteries negligible. Power has to be supplied for every conceivable combination of available or unavailable energy sources. Eraring’s contribution was 3 units (2,000 MW). Over 11 hrs that was 22,000 MWh or 22,000/1,400 = 16 Waratah batteries
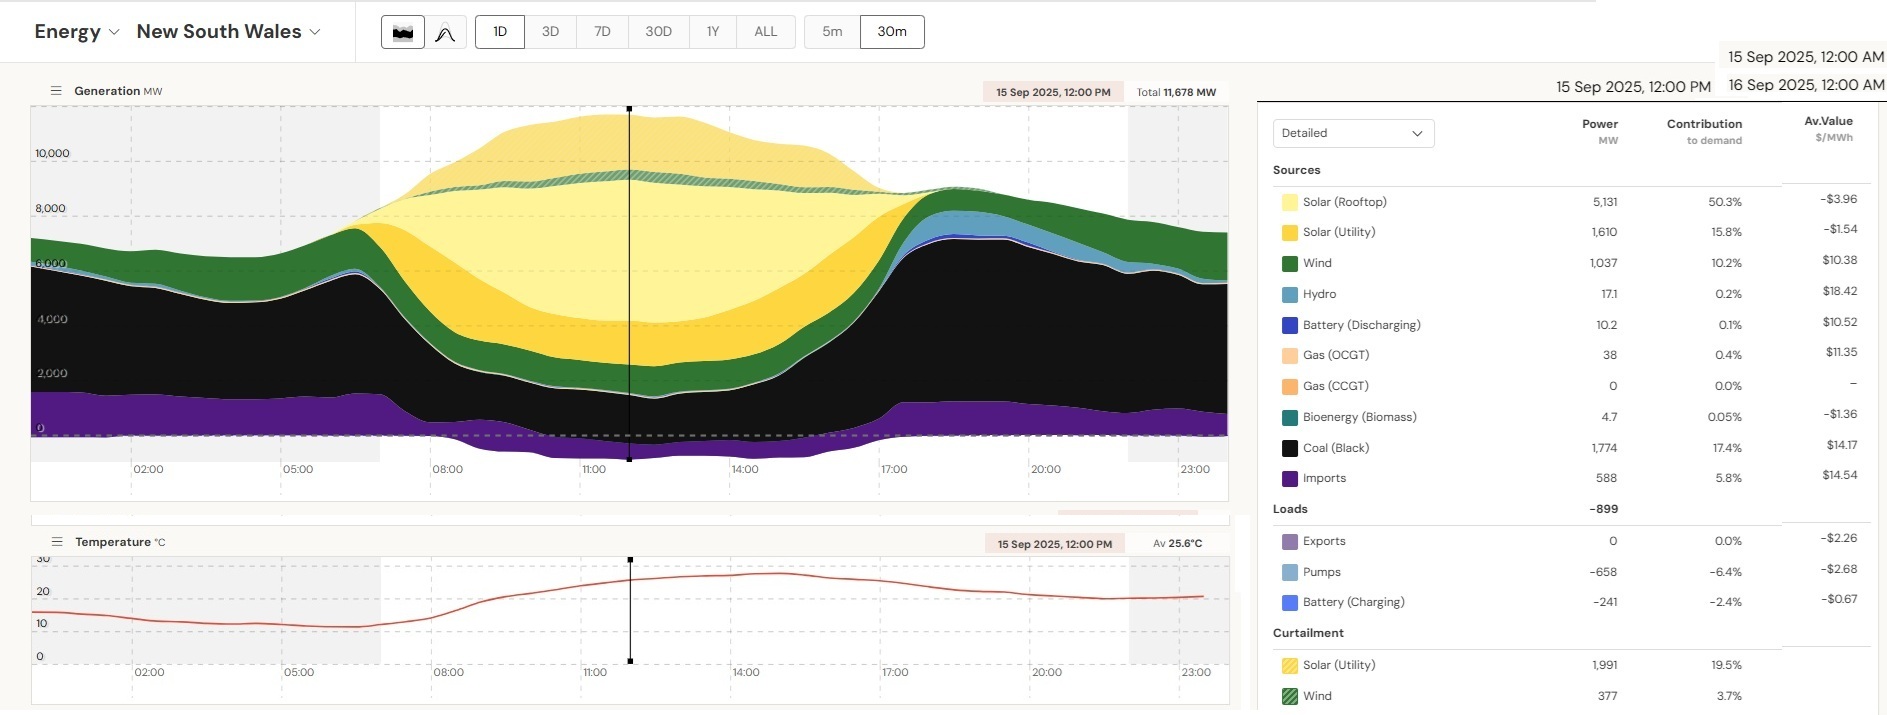 Fig 16: Curtailment of solar utilities on 15th September
Curtailment of solar utilities reached 2,000 MW or almost 20% of total supply at 12 noon. Coal generation was 1,800 MW at that time.
Minimum coal powered generation
From Fig 16 it can be seen that there is a minimum generation of coal plants during daytime. Theoretically, with all units operating we would have
Bayswater 260+3*170 MW
Eraring 4*180 MW
Mount Piper 2*150 MW
Vales Point 2*250 MW
Total 2,290 MW = sum of min generation
Of course, not all units are operating all the time.
On 15 September, we had 3 units off-line (BW04+ER04+VP5 = 170 +180 + 250 = 600 MW) so the minimum was 1,690 MW. From 27 September BW02 started a 2 shift operation on some days, reducing the minimum to 1,520 MW.
Hydro generation
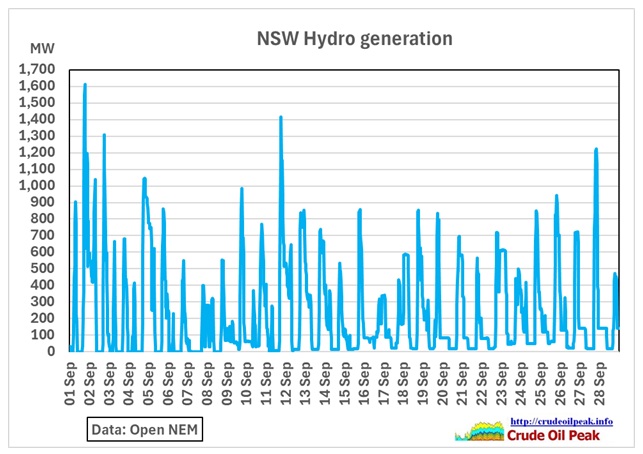 Fig 17: NSW pumped hydro generation
Assuming a turnaround efficiency of 75%, the pumps lifted the equivalent of 3,700 * 0.75% = 2,800 MWh/day into storage. This means the difference of 2,600 MWh/day was just hydro. NEM data do not include dam levels so we cannot know how sustainable that generation is if there is a drought (millennium drought 2002-2007, 2017-2019 )
There are 2 pumped hydro schemes in NSW, Tumut3 (600 MW/1,500 MW) and the much smaller Shoalhaven (240 MW/240 MW).
In the 30 days mid September – mid October Tumut3 generated 2,517 MWh, requiring pumping of 3,141 MWh (80% efficiency assuming dam levels have not changed)
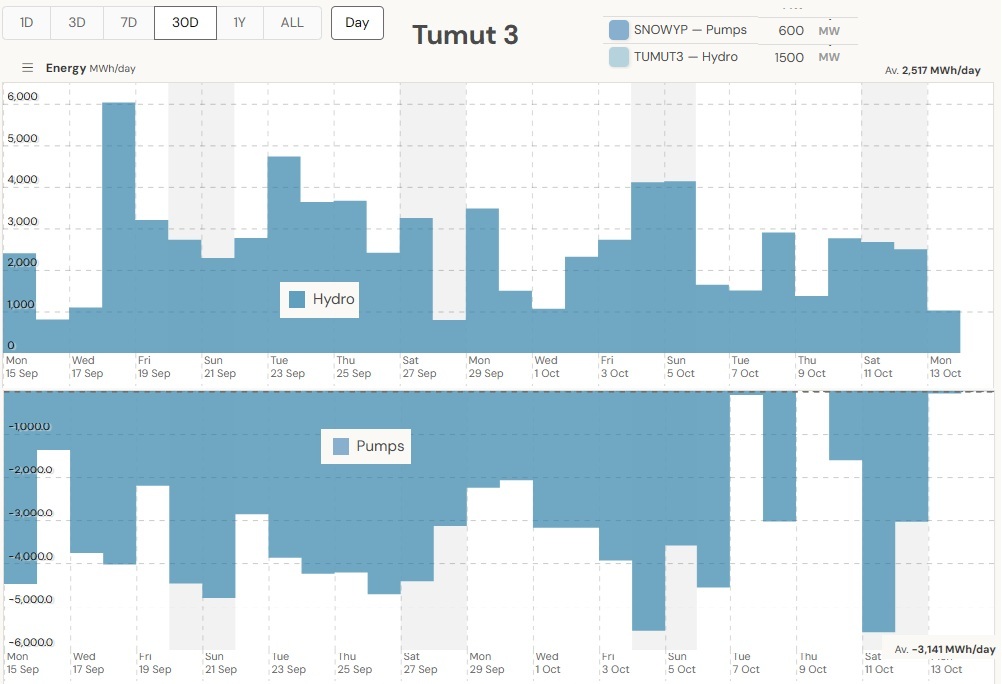 Fig 18: Tumut3 pumped hydro
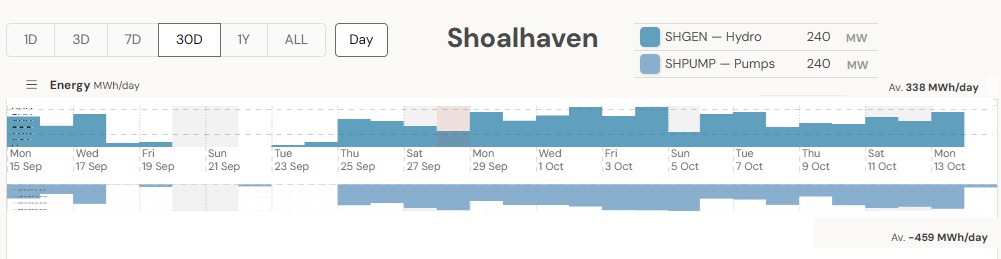 Fig 19: Shoalhaven – graph scaled down for size
Solar generation
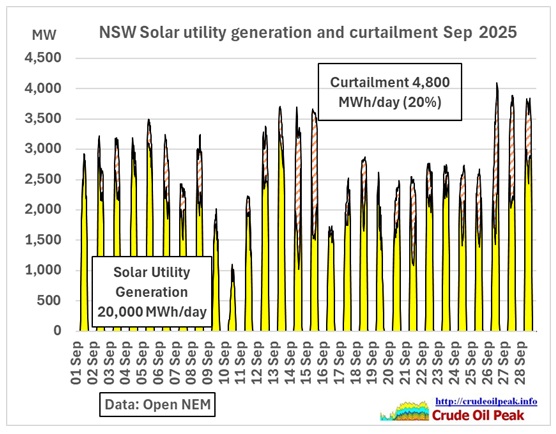 Fig 20: Solar utility generation and curtailment
The curtailment of solar utility generation is 19.5%. On 10 Sep there were torrential rainfalls
NSW tornadoes not rare as Sydney records heaviest September rain in 146 years
11 Sep 2025
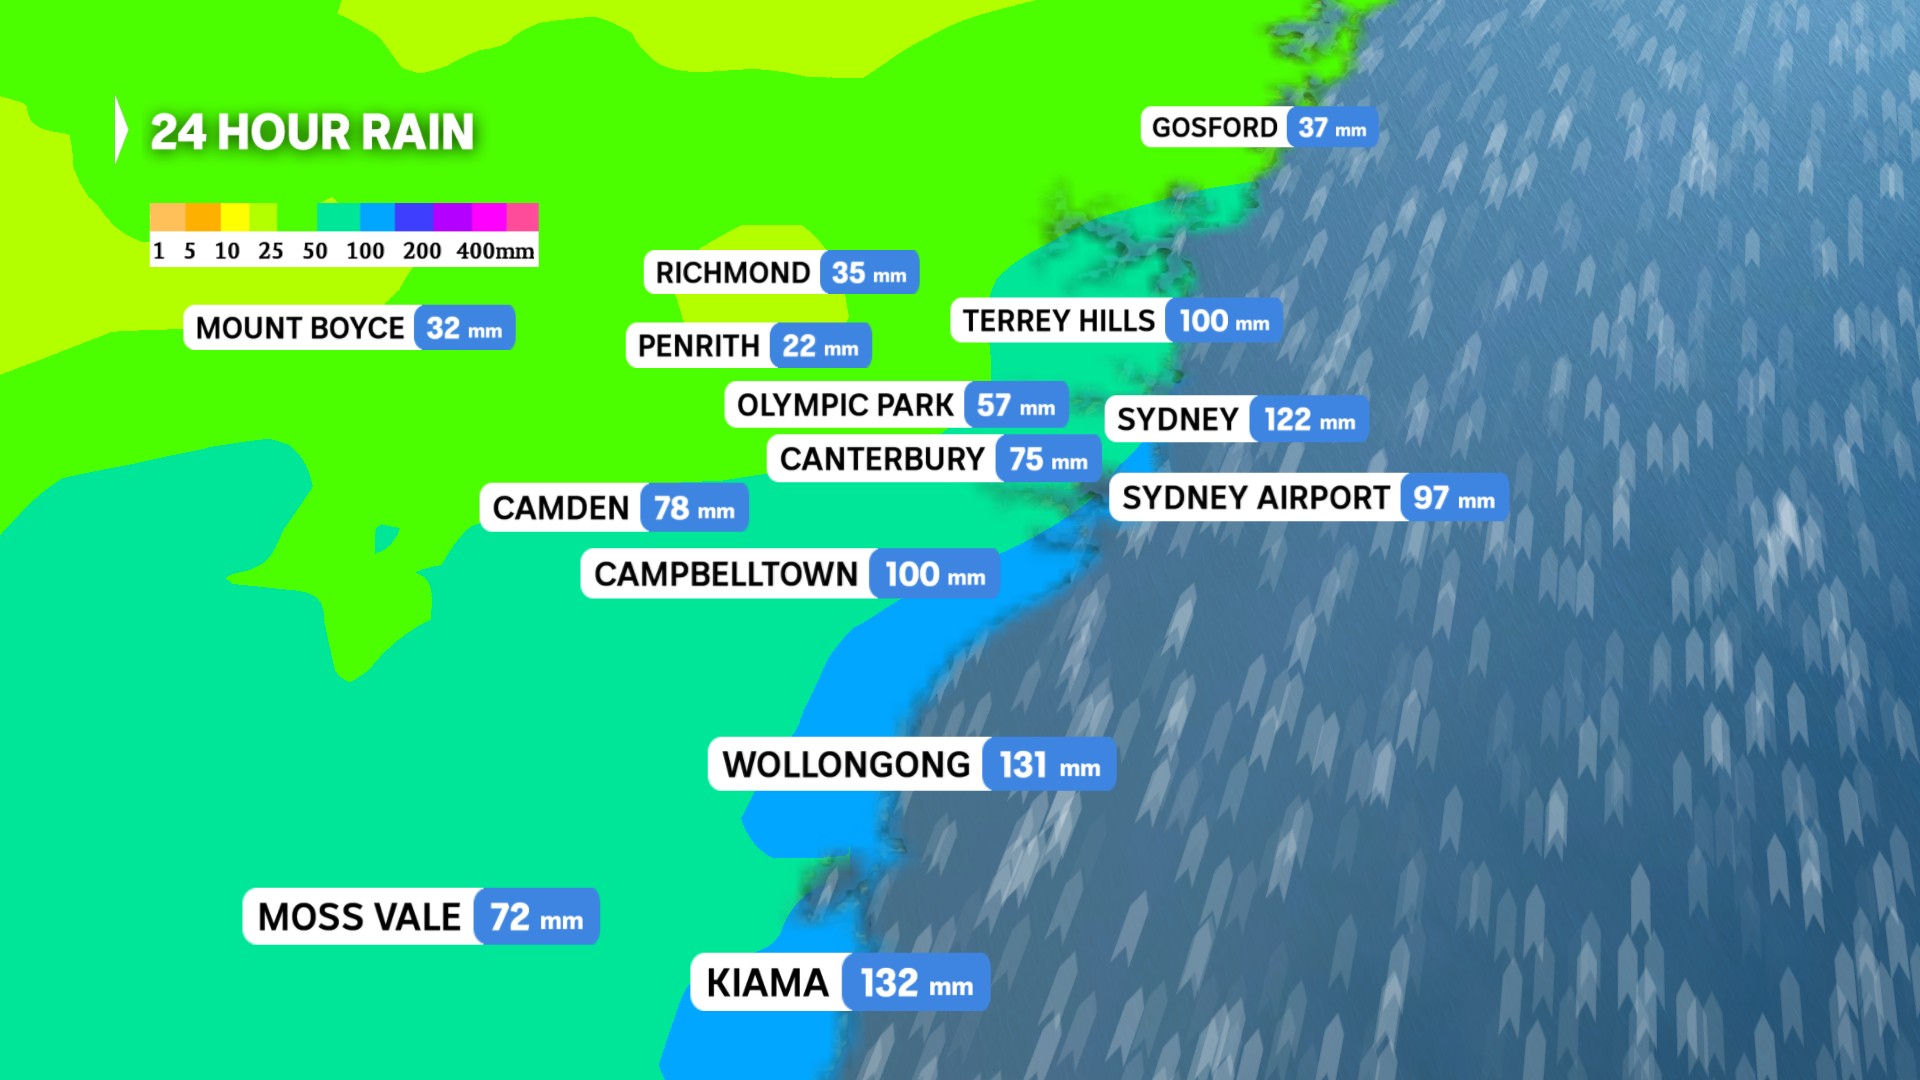
https://www.abc.net.au/news/2025-09-11/tornadoes-nsw-september-rain-rare-sydney-weather/105763072
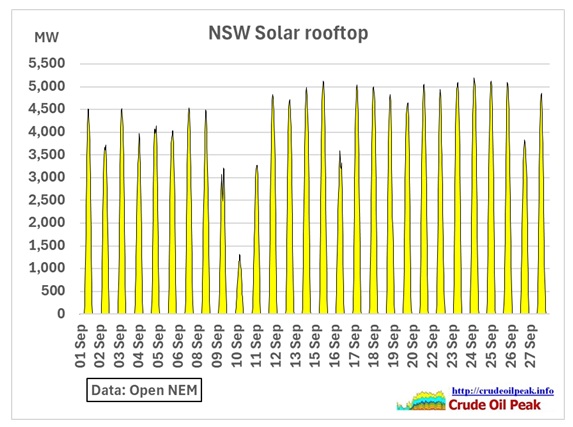 Fig 21: Solar roof top generation
This is an estimate of AEMO. The maximum generation increased by 16% during the month along with increasing sun shine hours. On 5 days, generation was substantially lower due to cloudy weather.
Wind generation
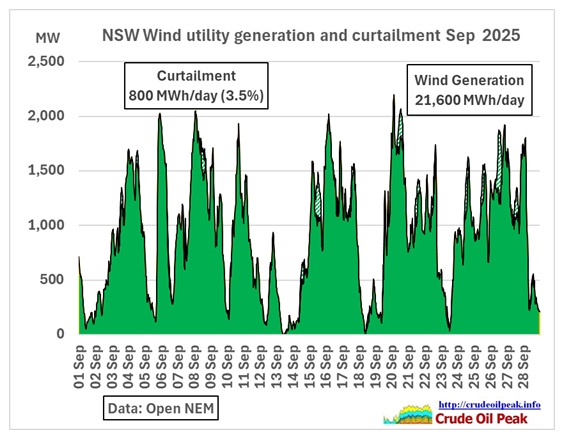 Fig 22: NSW wind farm generation
Average generation was 900 MW with a maximum of 2,200 MW
There were 9 periods when wind came in at below 200 MW (=10% of maximum)
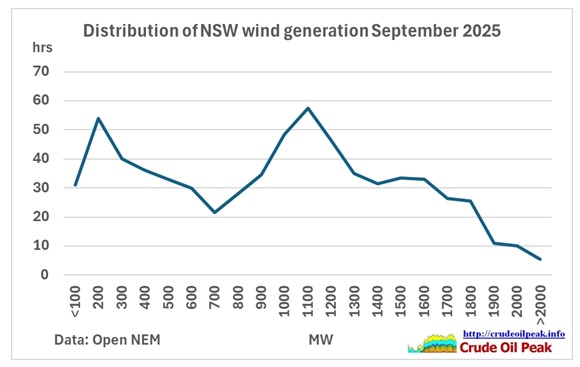 Fig 23: Distribution of NSW wind generation
The above graph shows for how many hrs each generation output (grouped in 100s of MW) was achieved. This is not a normal distribution. There are more cases with lower outputs. We arbitrarily define as a low wind output anything under 300 MW which is half a coal fired unit that can be ramped up in the afternoon if no other generation is available. There were 125 hrs of low wind output in 28 days or 19% of the time. The critical period is after sunset (no solar power) so we need to find low wind output in the evening and at night. There were 4 evenings/nights where the average output was less than 300 MW.
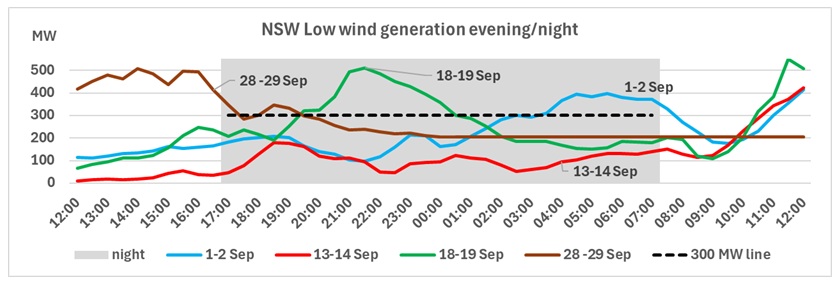 Fig 24: NSW low wind generation during
Output between 5 pm and 7 am
a) 13-14 Sep; av. 104 MW (temp. 11.1 degrees)
b) 28-29 Sep; av. 237 MW (temp 16.2 degrees)
c) 18-19 Sep; av. 277 MW, max 512 MW at 9:30 pm, min 152 MW at 5 am (temp 11.6)
d) 1-2 Sep; av. 287 MW, max 396 MW at 5:30 am, min 112 MW at 9 pm (temp 11 degrees)
Case c) is best as output was highest in the evening
NSW power imports/exports
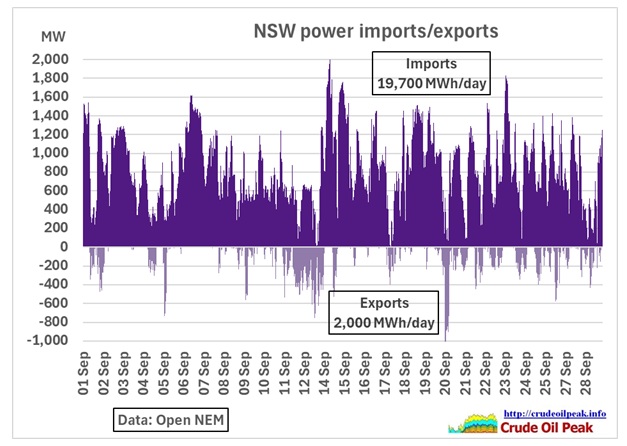 Fig 25: NSW power imports vs exports
Energy guzzler NSW is living beyond its means, almost continuously importing power from Queensland and Victoria.
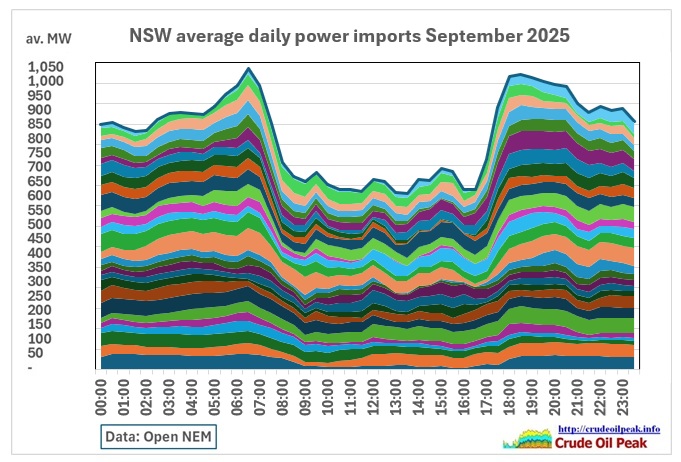 Fig 26: NSW power imports for 28 days (stacked in graph) in September
Average imports per day were 820 MW. During daytime hrs imports were 650 MW, during evening and night time hrs. 930 MW. This shows the importance of night time power supplies.
Gas peakers
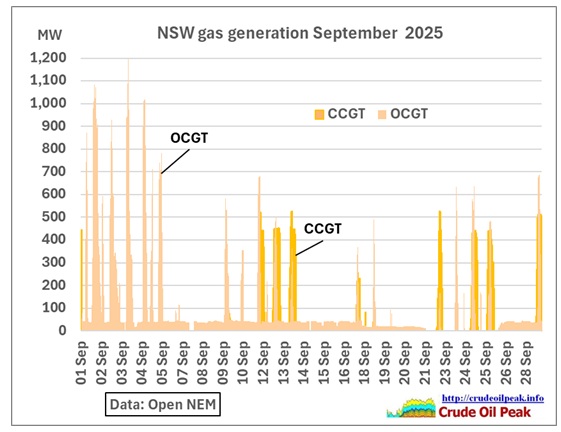 Fig 27: NSW gas power generation Sep 2025
Gas peakers were mainly used on 12 days.
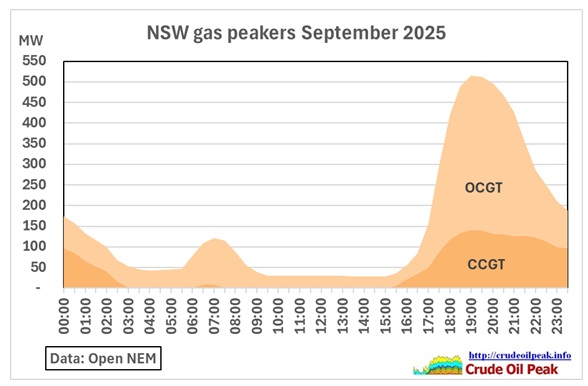 Fig 28: NSW average gas production profile for 28 days over 24 hrs
Conclusion:
Up to know, this website provided information on power supplies on an ad-hoc basis, i.e. when problems popped up which could no longer be ignored (prolonged price spikes, loadshedding). The reason for this analysis on a website on oil is that everyone assumes there will be a transition from oil based fuels to electric vehicles which of course requires sufficient power supplies. This question has become more urgent as a new competitor has entered the field: data centres.
Therefore, a power supply analysis must be done on a more regular basis, also to detect trends. The format of this monthly article is still under development and future monthly articles will improve on this and/or will focus on other issues which may emerge as we are passing through the 4 seasons.
Our power supplies depend on the output of well coordinated and sequenced generators, depending on many variable factors. Whether a 5 min bidding war between operators with different objectives can manage that is a big question. AEMO’s notices on lack-of-reserves and possible interventions show what will be needed to keep the lights on.
Ultimately, the purpose of this and future articles is to find out whether we can actually implement a proper, smooth transition from coal to renewables and whether we can afford what is generally assumed by all governments: perpetual growth of everything, including demand for power.