This post is a record of Monday the 10th of February 2017
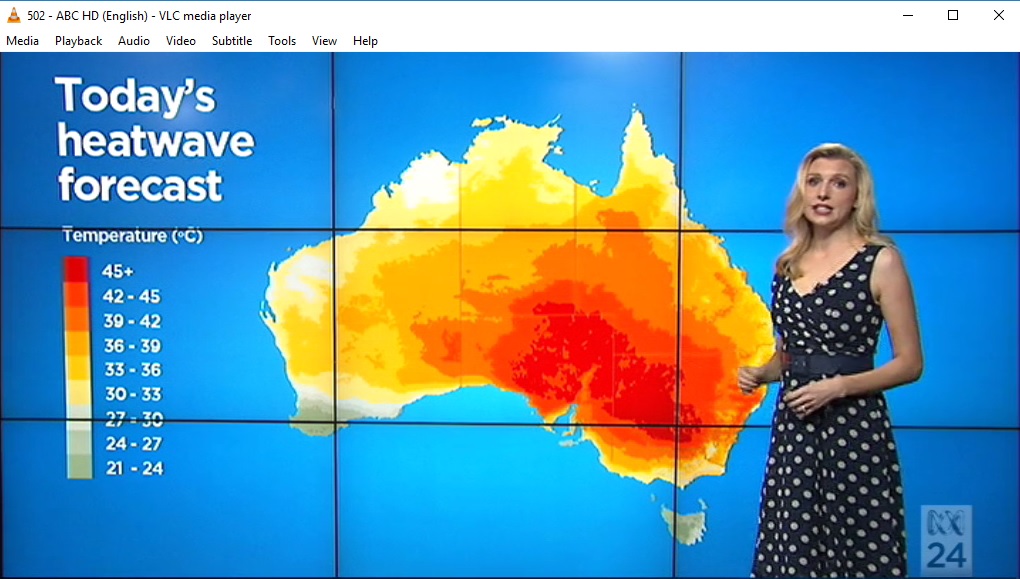
Fig 1: Heatwave forecast 10th February 2017
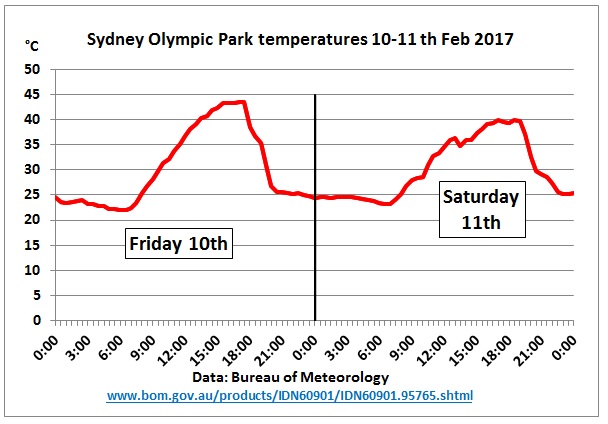 Fig 2: Sydney’s temperatures at Olympic Park
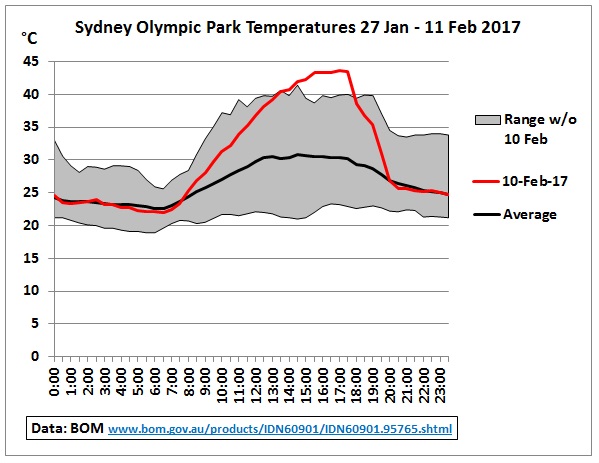
Fig 3: Range of temperatures during 2 summer weeks
Temperatures on the 10th went outside the range experienced in 2 summer weeks
The day does not start well. At 10:36 AEMO issues notice 57357 with a lack of reserve forecast level 3, the most severe warning implying load shedding
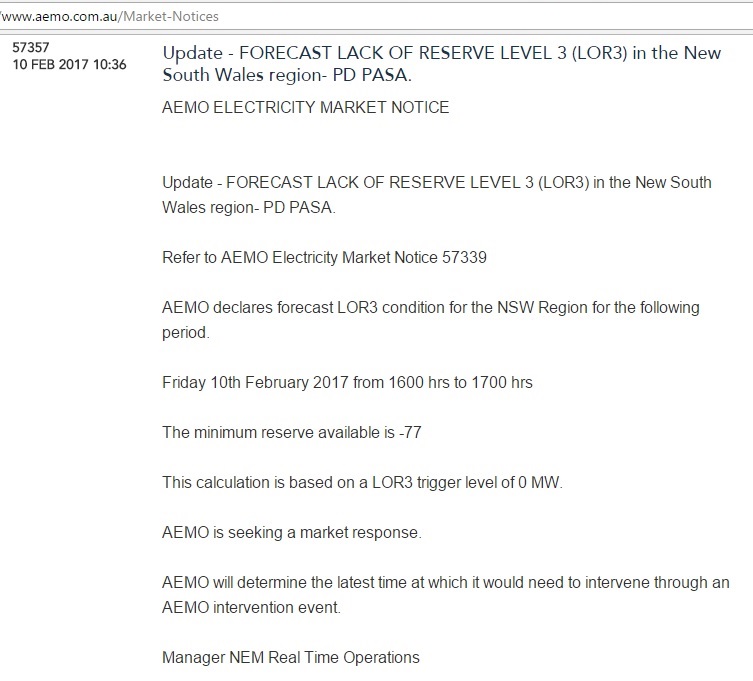
Fig 4: AEMO notice 57357 at 10:36
7 more notices were issued on this day including:
57359 13:00 LOR 1 with a reserve of 861 MW
57387 16:44 LOR 2 with a reserve of 570 MW
57396 17:20 LOR 3 with a load shedding of 310 MW
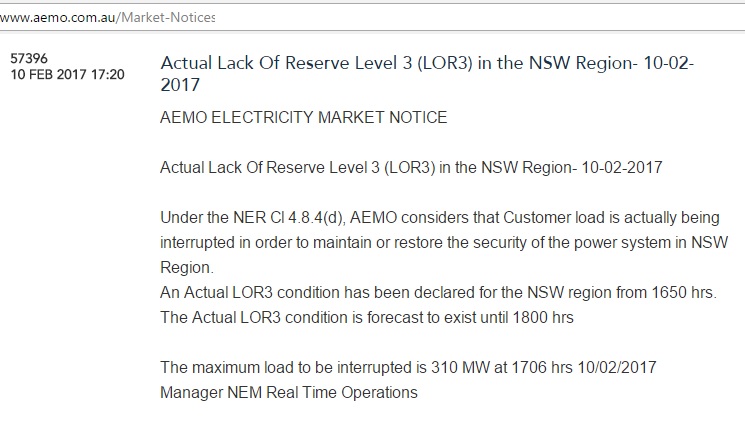
Fig 5: AEMO notice informing of load shedding
Let’s have a look at the data:
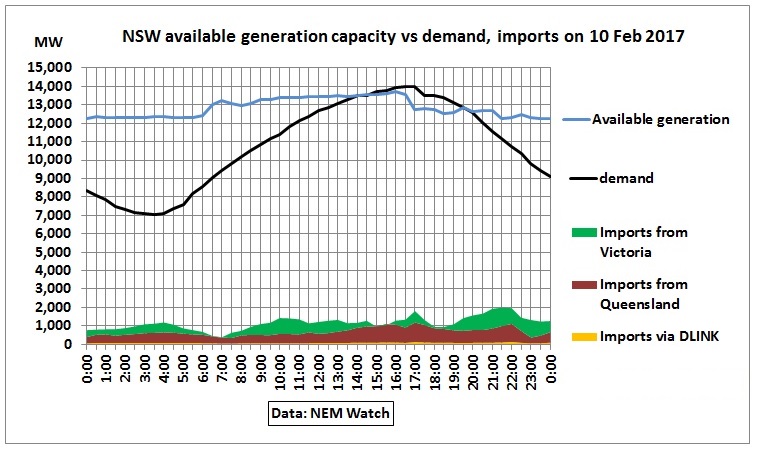
Fig 6: Available generation capacity vs demand and imports
We see an unexplained drop of available generation around 16:30 partially compensated by a short boost of imports from Victoria, followed by a dip in demand from the load shedding. There was also a drop of imports from Victoria.
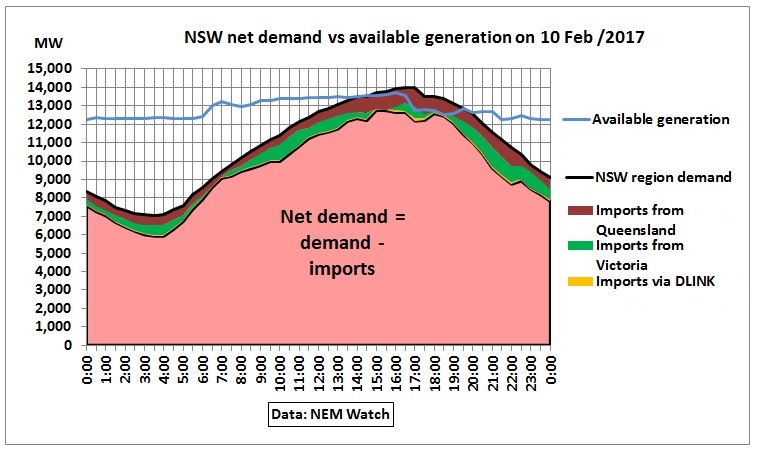
Fig 7: NSW net demand vs available generation
In the above graph we deduct imports from the demand to arrive at the net demand. This must be met by NSW’s available capacity. There must also be spare capacity of 1,340 MW
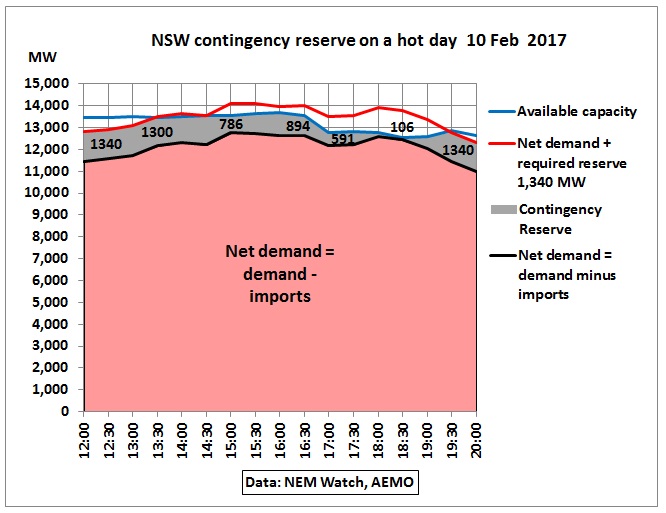
Fig 8: Average reserve levels in 30 m intervals
The AEMO notices are done on the basis of 5 min bidding, so are much stricter and therefore result in lower contingency reserve levels and then also shortages. So the above graph is only indicative of the gradual deterioration during the peaking period.
Why was the available capacity so low?
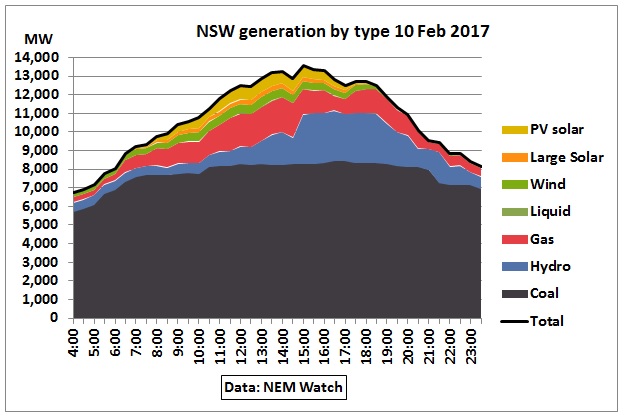
Fig 9: NSW generation by fuel on 10 Feb 2017
Coal generation was limited to around 8,400 MW and hydro to 2,700 MW. According to a table provided by AEMO in November 2016, NSW’s coal plants have a name plate capacity of 10,240 MW
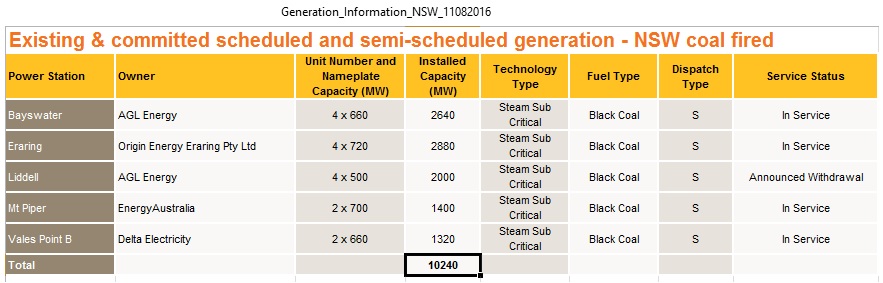
Fig 10: Name plate capacity of NSW coal fired power plants: 10,240 MW
9,500 MW were achieved in January this year but not on Feb 10th. As it happened 2 units of the ageing Liddell plant were shut down for emergency repairs.
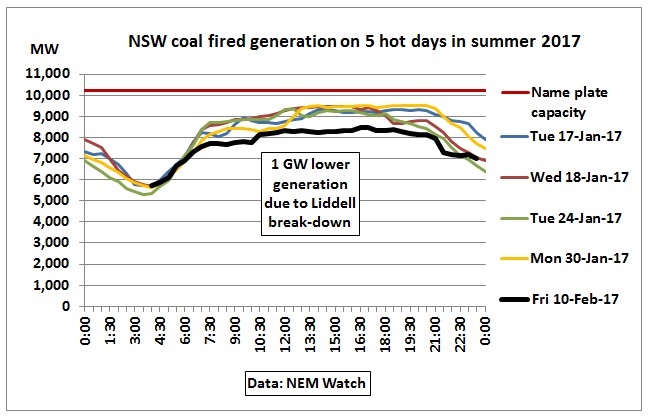 Fig 11: Lower generation on Friday 10th Feb
A day later, on 11 Feb 2017, AGL conceded:
The Liddell Power Station has been undergoing unavoidable maintenance due to boiler tube leaks and has two of its four units running at full capacity. A third unit is planned to return to service this afternoon in time for the peak demand, and the fourth unit is returning to service on 13 February.
This was not the first time it happened

Fig 12: Liddell power plant cooled by lake water
AGL shuts down Liddell coal fired power station units for repairs
21 March 2016
AGL Energy, the country’s biggest generator of coal-fired electricity, says it is shutting down all four units of its 2,000MW Liddell power station in the NSW Hunter Valley over the next few months so it can conduct inspections and repairs to external boiler tubes.
http://reneweconomy.com.au/agl-shuts-down-liddell-coal-fired-power-station-units-for-repairs-12915/
It is an irony that 2 days earlier, on 8 Feb 2017, Treasurer Scott Morrison praised the role of coal in Parliament in a bizarre presentation – bringing with him a lump of real coal, to the amusement of his colleagues.
Coal fired Australian Parliament

Fig 13: “This is coal — don’t be afraid, don’t be scared,”
Less amused was the aluminium smelter Tomago near Newcastle which was called upon to reduce electricity consumption. That can quickly freeze up their pot lines.
Fig 14: Pot lines animation https://vimeo.com/68344579
http://rollingball.com.au/portfolio/pot-lines-animation/
The power consumption of a smelter is huge.
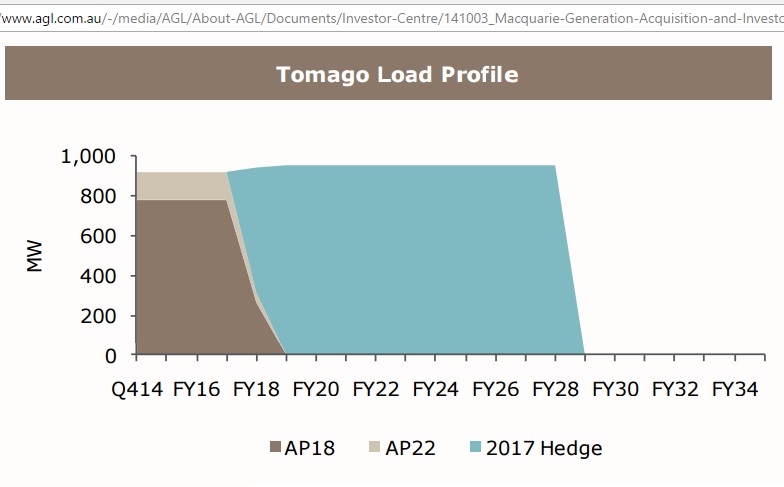
Fig 15: Tomago requires around 900 MW
A Dec 2015 report by Russ Skelton Associates submitted to AEMC describes the impact of load shedding:
“Whilst a 1 hour interruption is inconvenient and represents a loss of production, matters start to become serious at around the 2 hour mark. By the 3 hour mark it is anticipated that some pots would begin freezing. By 4 hours the situation would be irredeemable, resulting in all pots being frozen.
Getting auxiliary supplies to the smelters is important since this means they can begin reconfiguring the operation in anticipation of a lower supply. However, until supplies in the order of 200 MW are available, the rapid deterioration described above will continue.
Even 200 MW will not be sufficient to completely arrest the decline, but it will slow the process. Any plan that does not restore full supply to the smelter within 3 to 4 hours is likely to result in complete freeze of the pot lines.
The costs of remediating the smelter after such an event approach replacement cost”
In effect, reducing power supply to an aluminium smelter is a No-No. This demonstrates that the NSW government has no proper plan how to deal with a power shortage even if it is only 2%. Nor is the public prepared, not to mention motivated or educated how to reduce power consumption. The following snippet from a newspaper article tells everything:
NSW heatwave: Tomago aluminium smelter faces shutdown
10 Feb 2017 16:25
NSW energy minister Don Harwin said on Friday that the state government had not instructed any businesses to curtail their energy consumption.
“That’s not something the state government does,” he said.
He said Tomago’s situation was “more in the nature of what’s in their service agreement with their power supplier”
http://www.thecourier.com.au/story/4460832/tomago-smelter-faces-shutdown-in-heatwave/?cs=2452
What he means is this:
Nov 2010
The new Tomago contract also includes interruptibility clauses, allowing the supply of up to 900 megawatts of electricity to be suspended for a time if Macquarie Generation is facing severe generation disruptions.
https://www.investsmart.com.au/investment-news/tomago-settles-on-11-year-contract-with-state-owned-generator/20992
And that brings us to the ultimate irony of this drama. AGL bought the Liddell plant for zero dollars from MacGen then owned by the NSW government in 2014. What you pay is what you get.
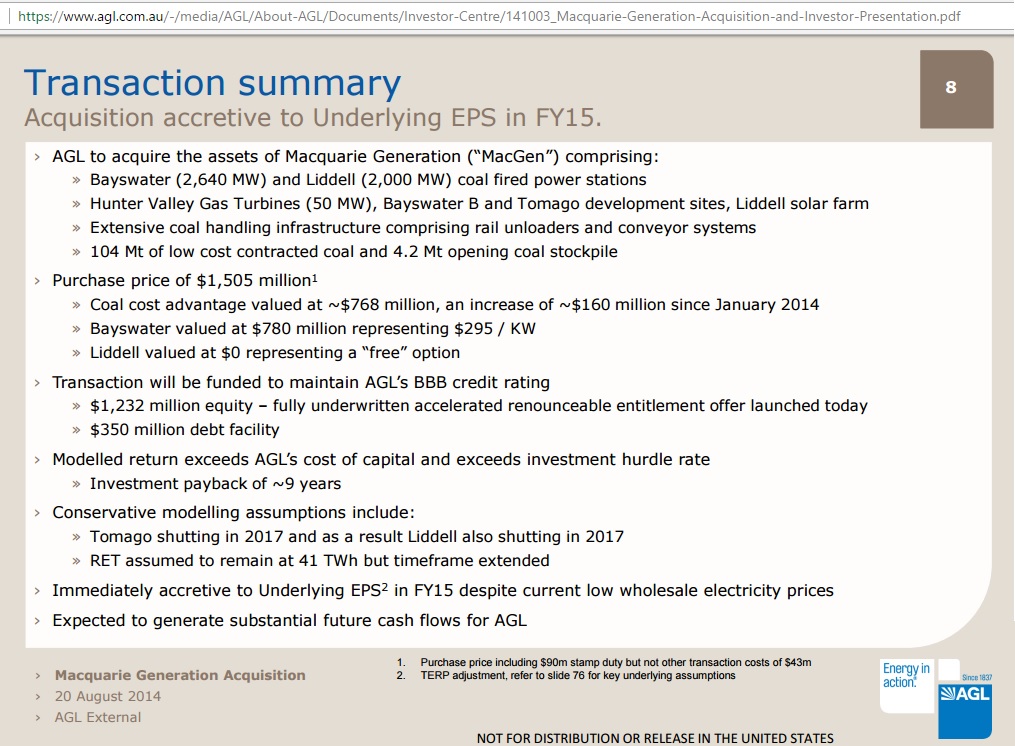 Fig 16: AGL investor presentation of August 2014.
Note Liddell is assessed as “free” in the above slide, with Tomago and therefore Liddell closing in 2017.
17 April 2015
However, there is confusion about what the closure of coal plants actually means. Liddell, for instance, was slated to close in 2017, but AGL may keep it open to 2022 because the Tomago aluminium smelter is likely to continue operations. At least it is no longer talking about extending its life.
http://reneweconomy.com.au/agl-plans-to-shut-down-coal-decarbonise-generation-by-2050-2050/
So how is Liddell performing right now?
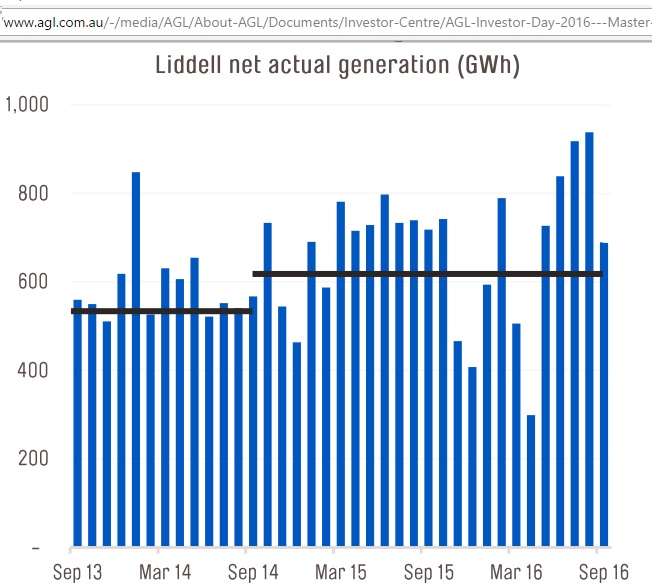
Fig 17: Liddell generation @ 650 GWh per month (900 MW)
https://www.agl.com.au/-/media/AGL/About-AGL/Documents/Investor-Centre/AGL-Investor-Day-2016—Master-Presentation—2717FINAL.pdf?la=en
Conclusion
AEMO will prepare a detailed report on this incident of load shedding. It will likely result in more blame games in Parliament. Aluminium is a strategic commodity. But Australia has no energy strategy to keep this industry alive. When Liddell closes at least 900 MW will be gone, the equivalent of Tomago’s demand.
The way things are going it will end up like the closure of the car-industry and the refineries. Energy guzzling Sydney including 100,000s of office workers in air conditioned offices (producing what?) would have to save 900 MW to rescue Tomago.
But NSW goes in the other direction. Instead of maintaining a productive aluminium industry, unproductive, energy hungry high rises and skyscrapers are being built in Sydney in a frenetic building boom – mainly for immigrants yet to arrive. No one tells them what uncertain energy future they face in a country with vast resources of solar energy but a political system which is unable to harness and manage it.
Update
16/2/2017
WattClarity has come out with more explanations.
Colongra gas power plant was unloading and Tallawarra gas plant tripped during a critical period of high demand (see drop in gas generation in Fig 9). Thanks God the hydro power plant Tumut 3 ramped up without hitches.
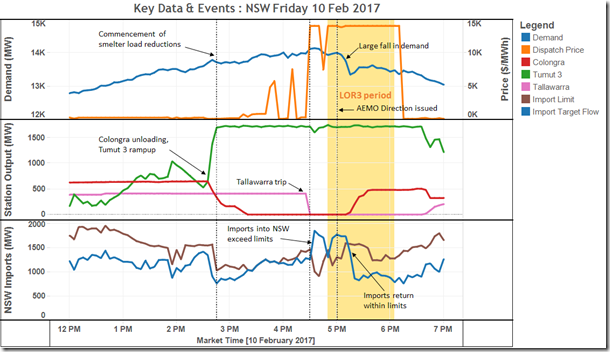
Fig 18 Key data and events
http://www.wattclarity.com.au/2017/02/key-events-timeline-nsw-friday-10-feb-2017/
So what we see here in this case is that not renewables but fossil fuel plants were the problem – contrary to what the Turnbull government claims
22/6/2017
AEMO publishes its report
SYSTEM EVENT REPORT
NEW SOUTH WALES,
10 FEBRUARY 2017
New South Wales operational demand (energy demand provided from the grid) peaked at 1630 hours at 14,181 MW (still lower than all-time maximum of 14,744 MW experienced in 1/2/2011)
Summary of events and failures
Liddell coal power plant
Units 2 & 4 under repair (2×500 MW)
Eraring coal power plant
11:05 Unit 3 output only 549 MW (capacity 720 MW) due to minor boiler tube leak
Vales Point coal power plant
16:09 Within one degree of reaching their absolute outlet temperature limit
Tallawarra gas plant
16:22 trips from 408 MW due to a fault in gas turbine
Colongra gas plant
16:50 All 4 units failed to start. Low gas pressure in fuel supply line as gas was used earlier in the day. 2 unit hrs gas in the pipe. Start with fuel oil also failed. 6-8 hrs of fuel oil available
18:37 Units 3 & 4 finally transitioned to fuel oil but ran out of gas to start units 1 & 2
Interconnectors thermal limits
Victoria-NSW 297 MW over limit
Queensland – NSW QNI 276 over limit
Tomago load shedding 290 MW
Pot lines 1-3 alternately taken out of service for 1 hr 15 min each
Previous related posts:
10 Feb 2017
NSW running low on contingency reserves during hot days
http://crudeoilpeak.info/nsw-running-low-on-contingency-reserves-during-hot-days
28/1/2017
Power Supply in Australia’s New South Wales: how will it cope in coming heatwave?
http://crudeoilpeak.info/power-supply-in-australias-new-south-wales-how-will-it-cope-in-coming-heatwave