The latest report “Integrated System Plan” of the Australian Energy Market Operator (AEMO) assumes that power consumption on Australia’s East Coast will stay rather flat despite government engineered immigration resulting in a population growth of 1.5% pa. This implies a call on all existing electricity consumers to save and provide power for all newcomers.
Let’s first have a look at what is happening with power supplies.
On Monday 16th July 2018, at 18:30, in the middle of winter with a temperature of 12.6 ֯C, total NSW power demand reached almost 12 GW, 300 GW short of 12.3 MW experienced in summer on 7/1/2018 at 16:30.
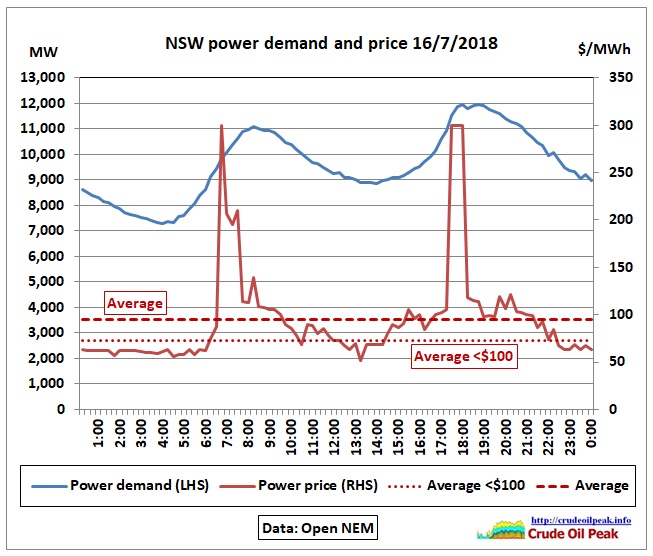 Fig 1: NSW power demand vs wholesale electricity prices
Before and during peak demands we see the spiking of electricity prices The average prices including peaks are 30% higher than the average price without the peaks.
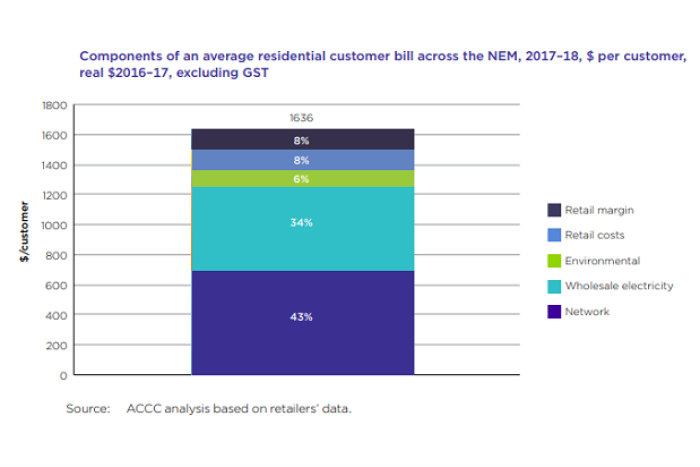
Fig 2: Composition of residential electricity bills
http://www.abc.net.au/news/2018-07-18/components-of-average-power-bill/10010484
The peak demand drives up the wholesale electricity component of bills for residential customers. What do Federal and State government do about it? The Feds are running an ambitious immigration program and the States are approving massive, energy consuming apartment projects.
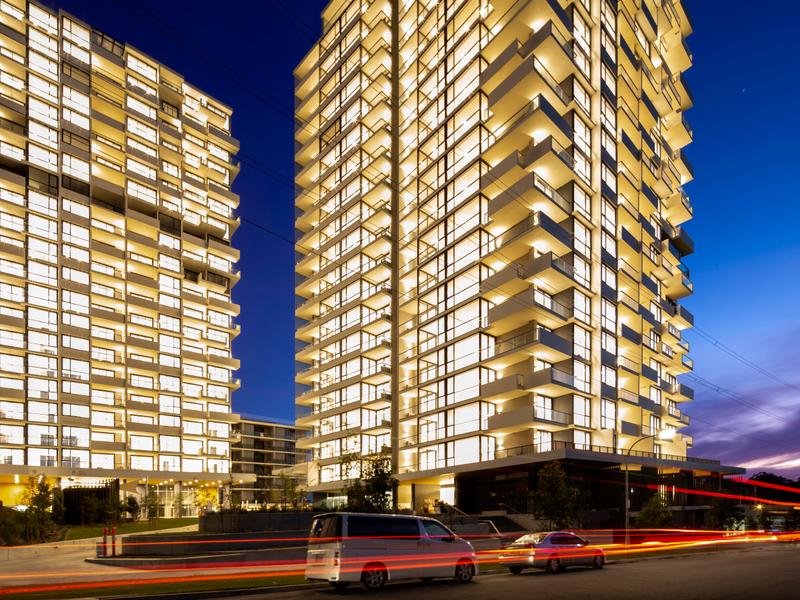 Fig 3: Polyhorizon, “First highrise opens” Northern District Times 13 June 2018
These structures push up peak demand as shown in this graph of the Parramatta Council:
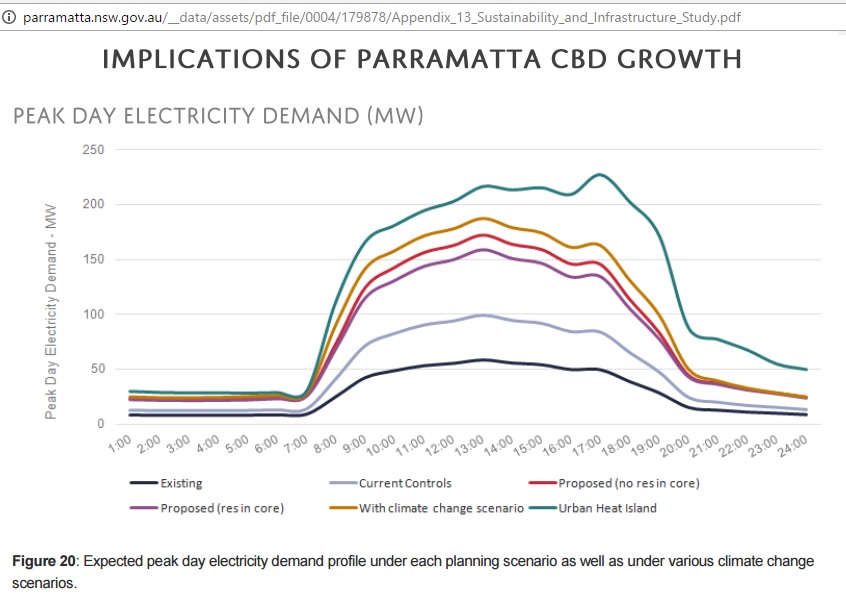 Fig 4: Peak demand of skyscrapers
Now back to the data for the 16th July 2018. NSW black coal power generation was around 7.6 GW and power imports from Queensland and Victoria 1.9 GW. In the previous week, on Thursday 12 July 2018, imports reached a whopping 2.2 GW. It is crystal clear that NSW is the Premier energy guzzler State in Australia and utterly dependent on power (and also gas) from neighbouring States.
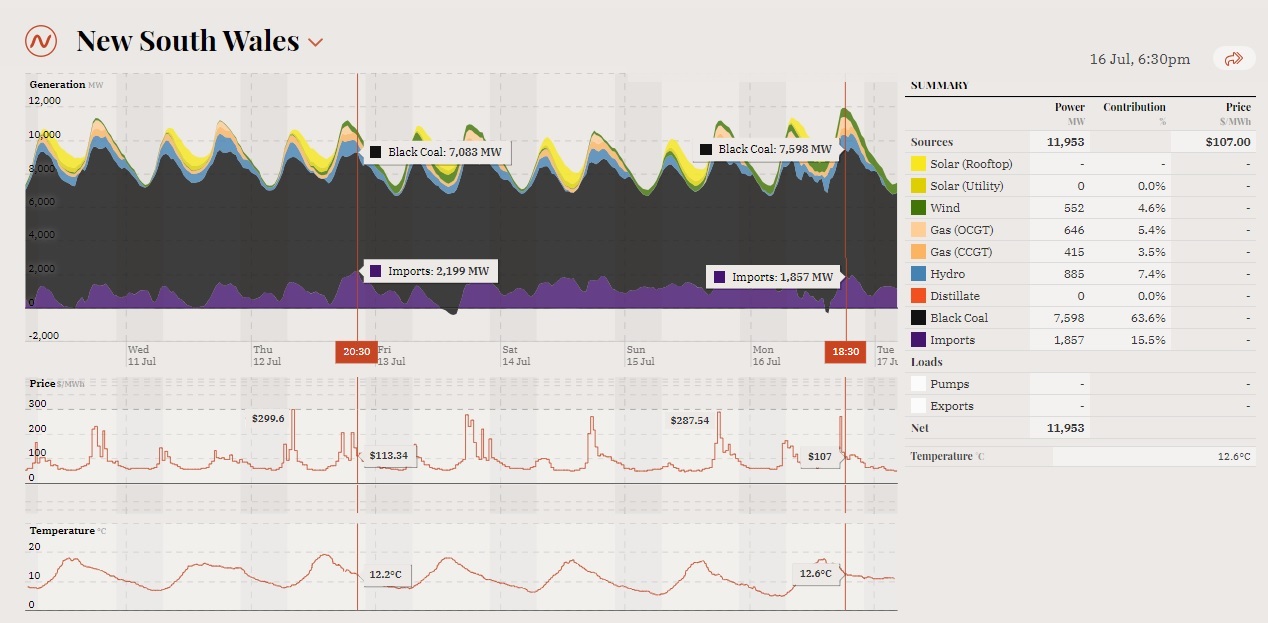 Fig 5: NSW power generation by type, imports
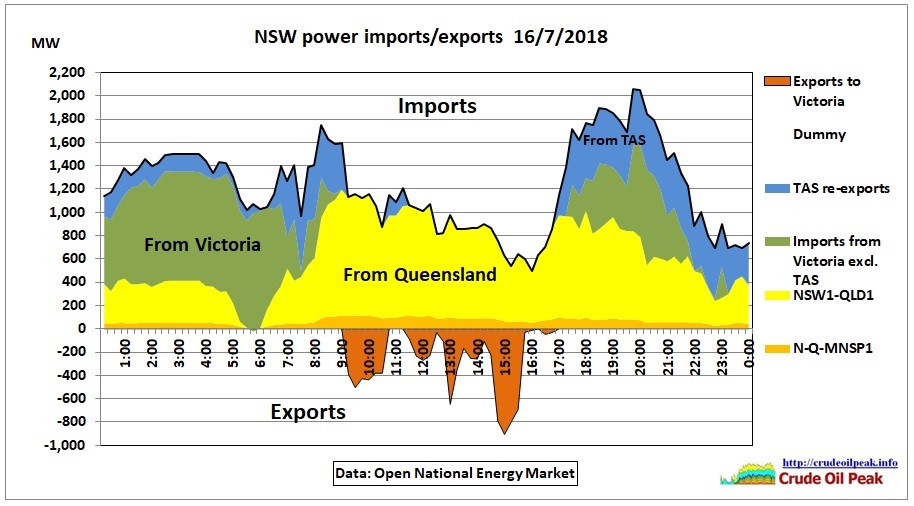 Fig 6: NSW power imports/exports
NSW imports from Victoria are by no means guaranteed because the power supply situation there is also tight after the closure of the brown coal fired Hazelwood plant in March 2017. Fig 6 shows to which extent NSW imports from Victoria are actually re-exports from Tasmania. Some of the NSW export peaks (negative MW) come from hydro power:
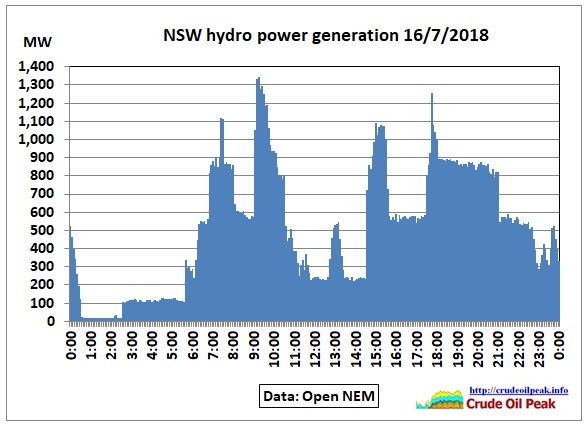 Fig 7: NSW hydro power generation
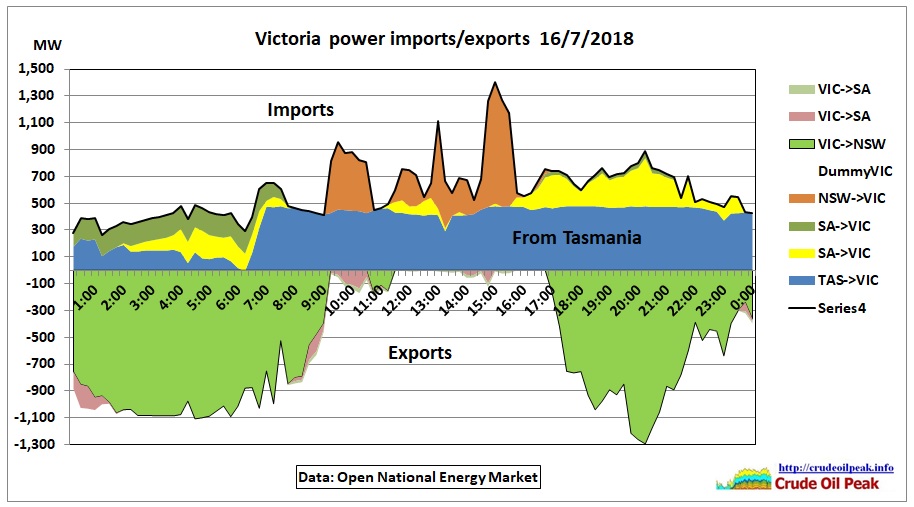
Fig 8: Victoria power imports/exports
In the above graph, Victoria imports an average of 600 MW while it exports 575 MW, slightly in deficit. Note the dependency on Tasmania’s hydro power.
Fig 5 and the following graphs are from: https://opennem.org.au
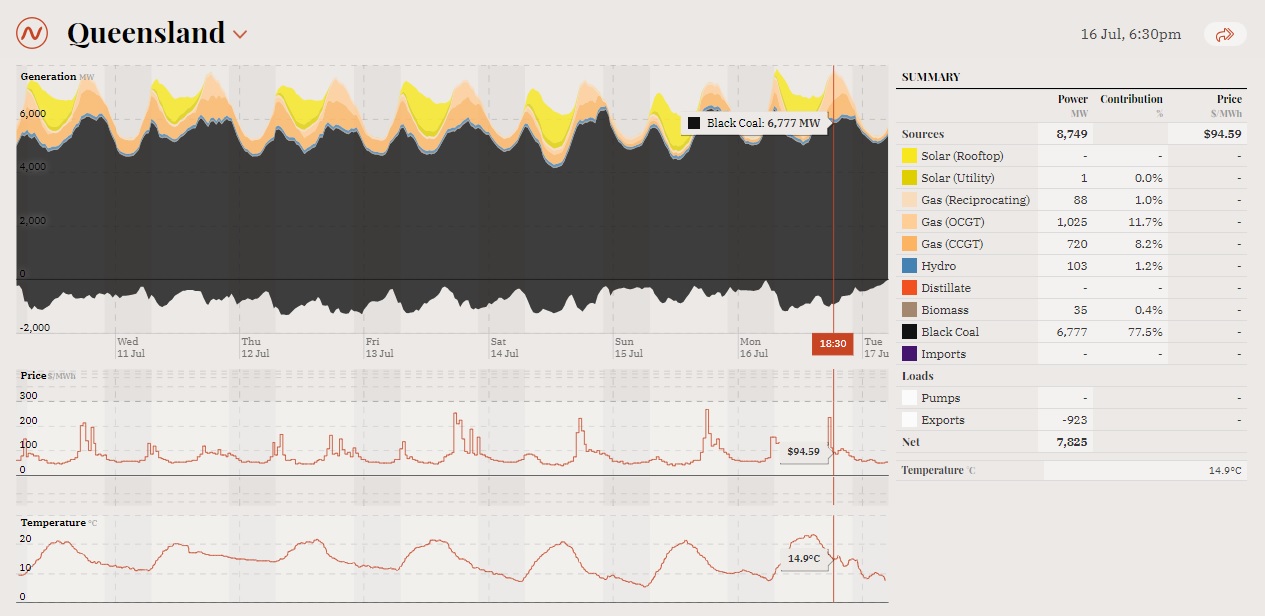 Fig 9: Queensland power generation by type
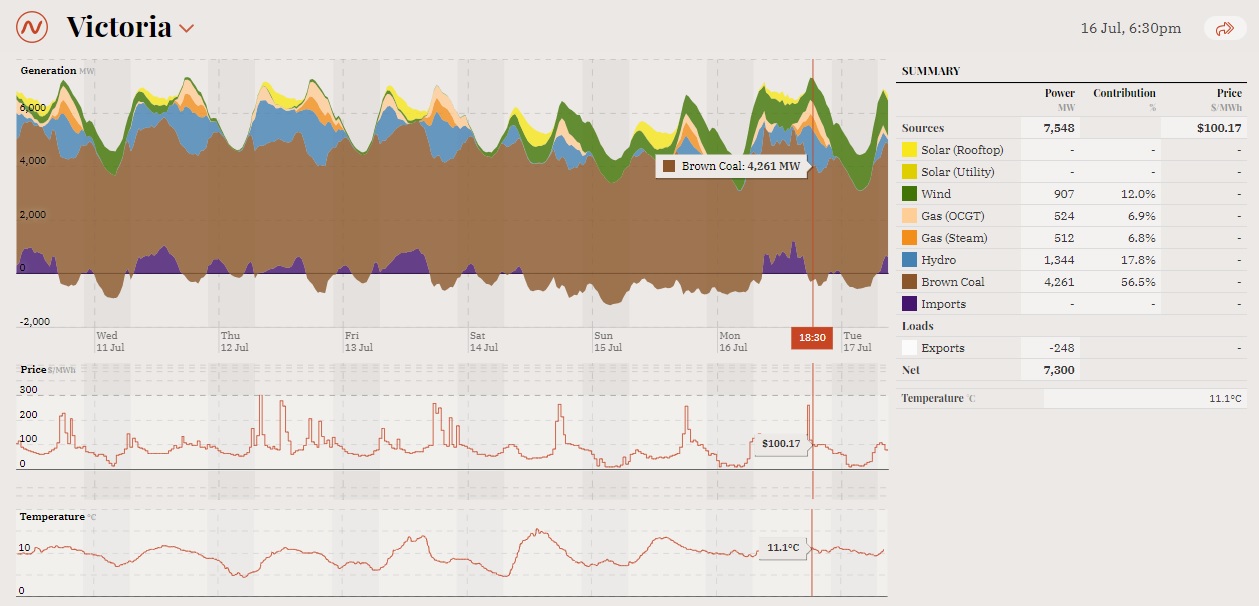 Fig 10: Victoria power generation by type
Victoria’s power generation is dominated by 4.7 GW of brown coal, running 24/7.
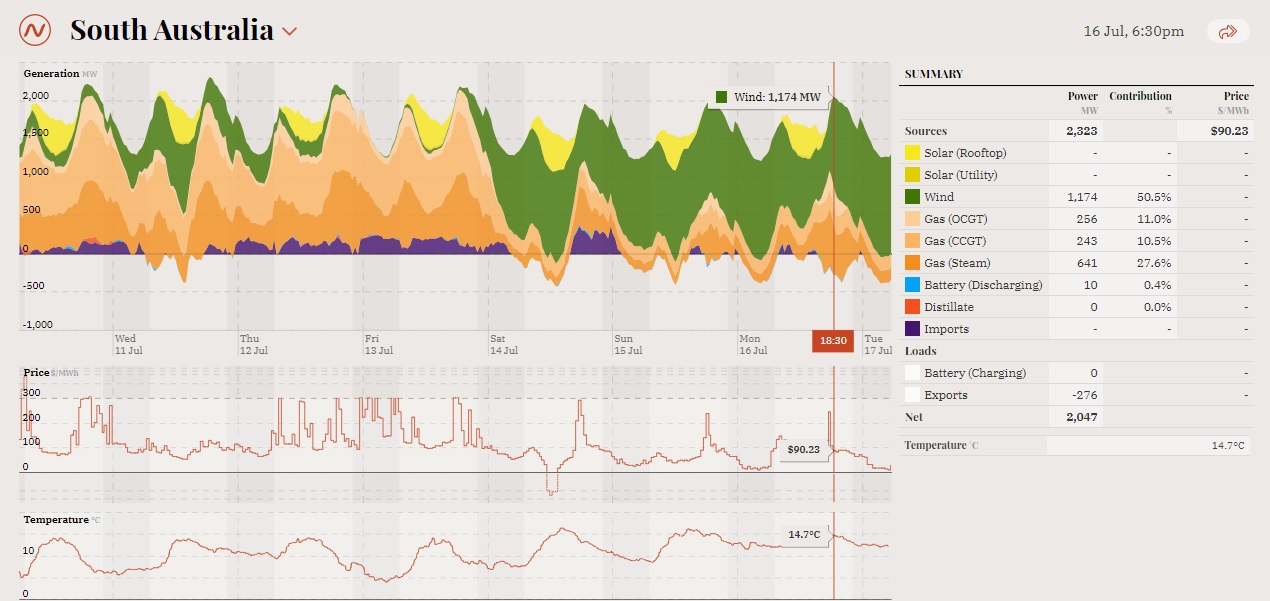 Fig 11: South Australia power generation by type
We see South Australia running in 2 modes: (a) a lot of wind + some gas (b) a lot of gas and some wind or no wind. Plus solar and occasional imports from Victoria.
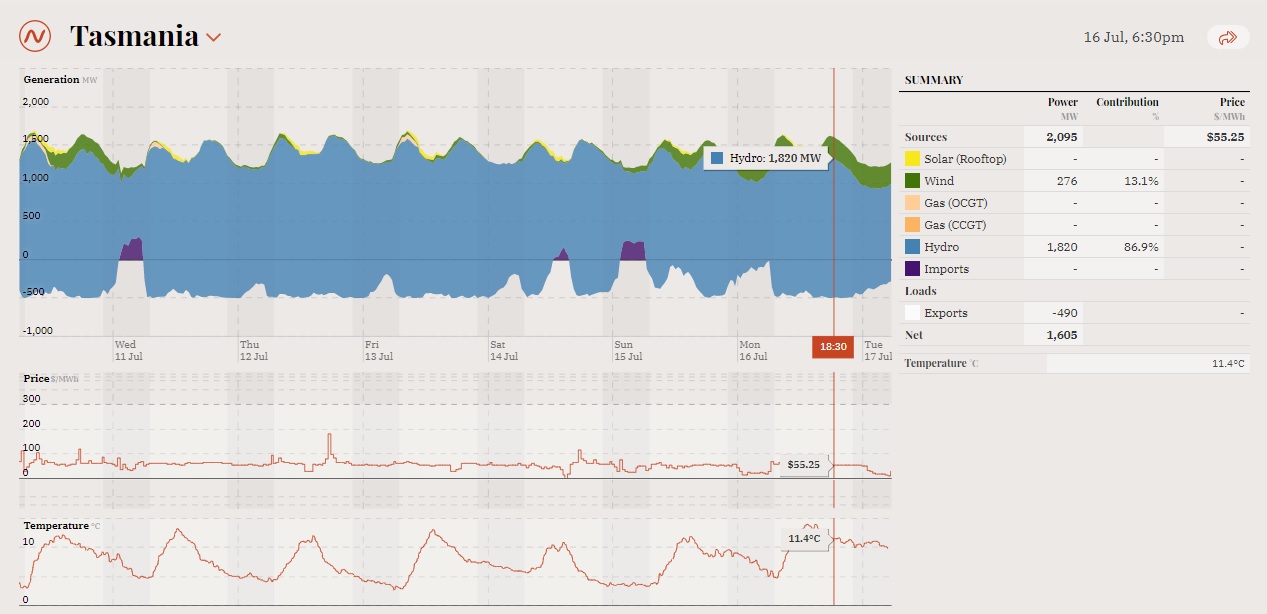 Fig 12: South Australia power generation by type
Tasmania exports hydro-power to the mainland and therefore acts like a giant battery. It is in the national interest to monitor rainfalls and dam levels there. The interconnector is fragile. It broke down already twice in recent years.
AEMO’s Integrated System Plan
17/7/2018
The Australian Energy Market Operator (AEMO) knows about all these problems of course and recommends to increase the capacity of inter-connectors between Queensland, NSW and Victoria (immediately by 170-460 MW and by another 380 MW in the mid 20s) and to build a new inter-connector between South Australia and NSW (750 MW). This will not be cheap.
Consumption growth
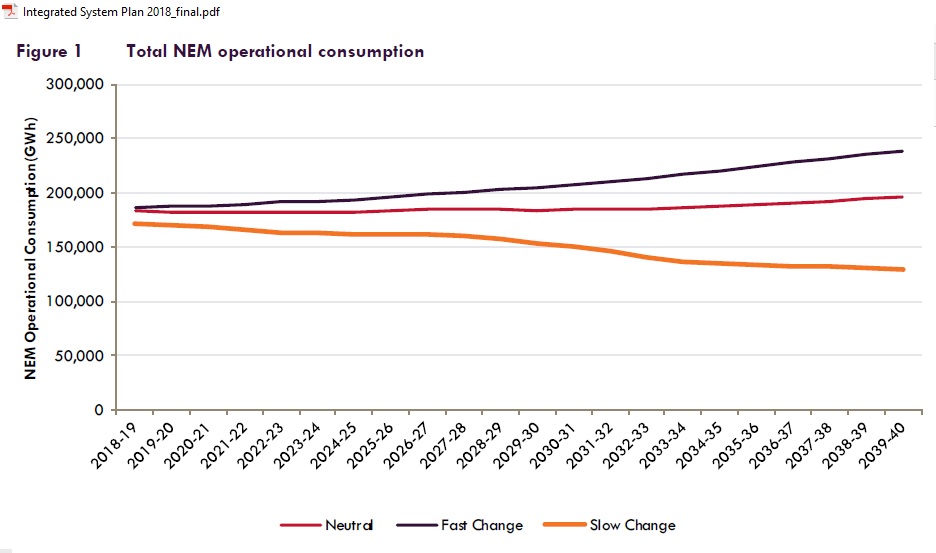 Fig 13: AEMO’s consumption growth scenarios
Table 1 on p. 26 describes the parameters for these scenarios. Fast change includes strong economic growth, weak demand side participation and strong uptake of EVs. The growth is around 1% pa but picks up in the 2030s. Slow change means weak economic growth (with some industrial closures), strong demand side participation and weak EV uptake. In the neutral scenario, 10% of all vehicles are electric by 2030.
Strangely enough, the rate of immigration and therefore population growth is not mentioned in table 1 nor anywhere else in the document. According to the NSW planning department, natural population growth is very modest as shown in the following graph for Sydney. Growth is mainly caused by high immigration.
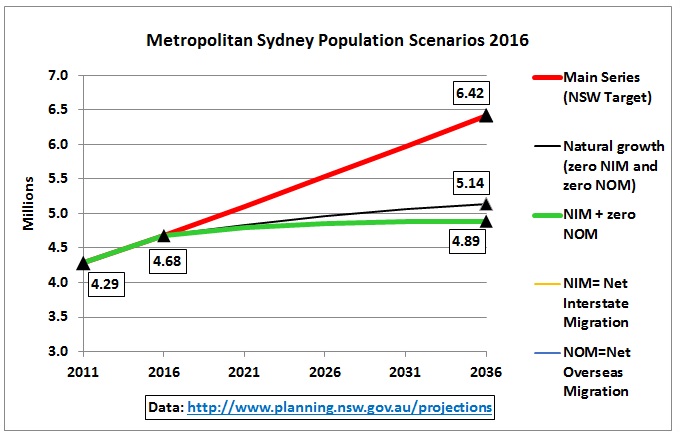 Fig 14: Sydney’s population growth @1.5% pa engineered by high immigration
In Chapter 2.3 the AEMO report states:
“Demand forecasts – underlying demand for power (at consumers’ power points) is projected to increase, due to population and economic growth. Much of this growth, however, is projected to be met by DER ([distributed energy resources] such as rooftop PV) and energy efficiency. As a result, demand for grid-supplied energy is forecast to remain relatively flat over the outlook period, and load growth is not the primary driver of new investment in this ISP. Local pockets of demand growth are still projected, and will need to be addressed and coordinated within the broader plans (see Section 2.3.2 for more detail on forecast trends in electricity consumption)…”
http://energylive.aemo.com.au/News/-/media/FA01D34E19E0484BB3697016B7A58159.ashx
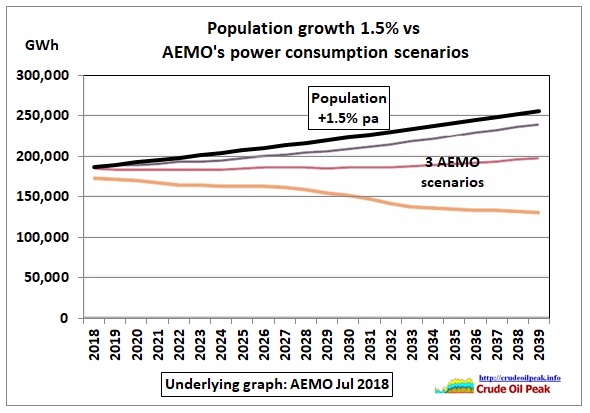 Fig 15: population growth @1.5% pa vs AEMO scenarios
Save, baby, save
No quantitative analysis has been done in section 2.3.2 to prove that DER can offset the additional energy requirement from immigration. It is therefore an untested assumption. What AEMO basically says is that whatever additional demand from immigration, this must be provided by all other consumers either by savings or rooftop solar which of course must go along with battery storage. Good luck.
And what means “addressed and coordinated within broader plans”? Which plans? These must be the plans of the oil & energy illiterate Greater Sydney Commission, headed by the Prime Minister’s wife Lucy Turnbull, assuming perpetual growth:
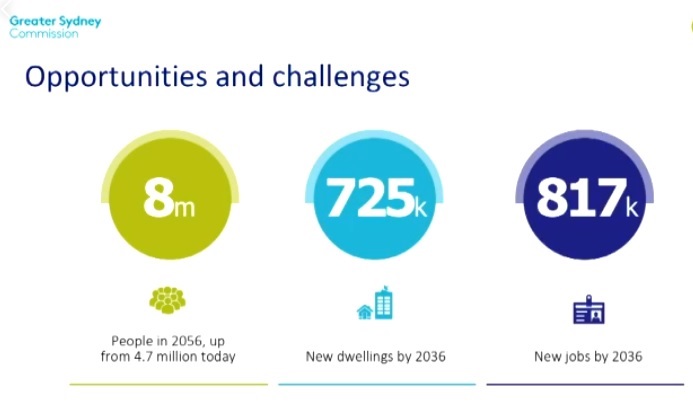 Fig 16: An 8 million Sydney by 2056
https://www.greater.sydney/metropolis-of-three-cities
AEMO’s chapter 2.3.2 it says: “Western Sydney and other city fringe locations are expected to experience greater population growth as our capital cities expand. Further work is required to investigate and incorporate sub-regional demands into future assessments.”
But the following GSC graph suggests that absolute population numbers would increase more in the “Eastern Harbour City”
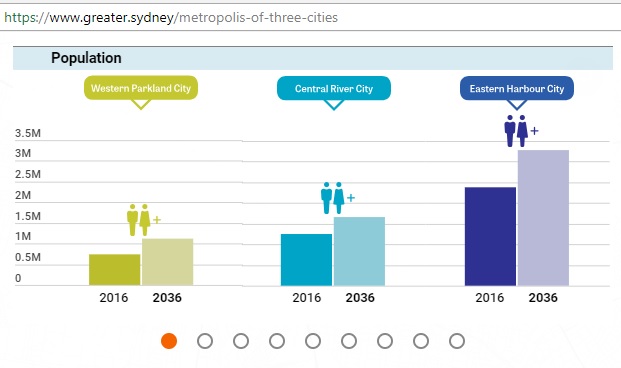 Fig 17: Distribution of population growth in Sydney
So indeed, much more work needs to be done. Sydney’s DER must be properly estimated suburb by suburb. These calculations are to be used to determine the future level of immigration along with many other limiting factors like oil supplies, pollution levels, availability of water etc. DER needs then to be promoted/implemented by government action. But the political debate about climate change and renewable energy has been toxic for the last 11 years.
Let’s see how these apartment towers (Fig 2) are doing. There is no rooftop solar on the penthouses. And if they had PV panels, they would provide very little power for the 500 dwelling units. So 500 houses in Epping would have to install ADDITIONAL panels just for these towers. Have house owners been informed about their duties? Has any public consultation been done? Have dots been connected to the very timid immigration debate? Many more flats are under construction and planned. Thanks God the apartment towers do not seem to be occupied, at least for now. Next summer, when there are simultaneous heatwaves in Queensland, NSW and Victoria, will be very interesting.
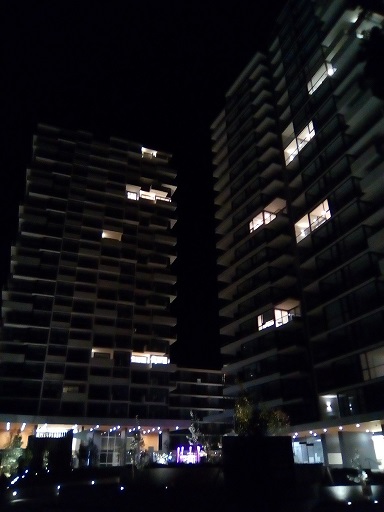 Fig 18: Polyhorizon towers from Fig 2 on 19/6/2018
Conclusion:
Project decisions assuming a continuing population/immigration growth for decades to come are done first and then reports are written around it. It is the same flawed planning approach like building more road tunnels and a 2nd Sydney airport without having estimated future oil supplies. There can be only one outcome: economic and financial damage.
Previous related posts:
16/3/2018
NSW coal power maxed out in hot summer (part 2)
http://crudeoilpeak.info/nsw-coal-power-maxed-out-in-hot-summer-part-2
14/3/2018
NSW coal power maxed out in hot summer (part 1)
http://crudeoilpeak.info/nsw-coal-power-maxed-out-in-hot-summer-part-1
11/3/2018
Australia’s east coast solar generation is replacing coal by only 2% in late summer
http://crudeoilpeak.info/australias-east-coast-solar-generation-is-replacing-coal-by-only-2-in-late-summer