For a modest traffic increase of 3% motorists in Sydney’s North West pay 22% more tolls after the M2 was widened from 2 lanes to 3 lanes and additional ramps were built. The average toll paid is 18 points above the all group weighted CPI for capital cities and 8 points above the maximum allowable increase of 1% per quarter. This means that toll-ways are inflationary and add to cost-of-living pressures.
In the 3rd quarter of 2010, the year before the widening started, quarterly toll revenue was $ 37 million for an average daily traffic of 97,000. Three years later, in the same quarter (thus no seasonal variations) and after the new lanes and ramps were opened, average daily traffic went up by just 3,000 to 100,000, but tolls paid by motorists increased to $ 45 million, a 22% increase.
This disproportionate revenue blow-out demonstrates the skyrocketing marginal cost of trying to grow the motorway infrastructure of an already unsustainable city with a difficult topography and where all participants in this tollopoly game take advantage of this situation and maximise their cut. Yet, the higher tolls are unlikely to allow paying back the debt incurred to finance the widening. At least up to now, toll-way debt is rolled over on a regular basis, not to mention that adequate tax is being paid. What’s worse, investors lose their money when assumed traffic volumes don’t materialise as was already the case with 4 road tunnels in Sydney and Brisbane.

Using traffic data published 9/10/2013 http://www.transurban.com/1064.htm we see that in the 3rd Quarter 2013 traffic had not reached pre-widening trends but was nevertheless 2% higher than the last quarter before construction of the 3rd lane started. The additional lanes opened in August so there was still one month with 2 lane capacities. It will take several quarters to see whether the “upgrade” traffic increases towards the 16% above-trend-growth predicted for end 2016 (see slide 37 in http://www.transurban.com/FY11_Results_Presentation.pdf )

This graph shows that increased traffic in 2013 was mainly generated by the new ramps. At the toll-plazas, ADT for the 3rd quarter in 2013 (95,057) had not reached the level of 3 years ago (96,983). As in the previous graph, light blue columns depict traffic during the construction period.
Cost of running Sydney
The additional traffic on the ramps comes at a high price for all motorists using the M2 and also for the community at large.

The graph shows that the toll-cost of using the M2 has shot up substantially in the last 2 quarters of 2013. Money which is wasted on tolls (and petrol) cannot be spent elsewhere. It is simply the cost of running Sydney with its uneconomic suburban structure requiring long distance commuting by car.
The revenue includes now tolls collected on new ramps at Herring and Christie Roads (short trip to/from Lane Cove tunnel), Pennant Hills Rd (trip to/from M7) and Windsor Rd (a short trip to/from M7).

http://www.hillsm2.com.au/tolls.htm
.
Driving inflation
Transurban’s ASX release 23/9/2013 refers to what the NSW government allowed:
“The Hills M2 Concession Agreement provides for the increase of tolls quarterly by the greater of the quarterly consumer price index or 1.0 per cent.” http://news.iguana2.com/transurban/ASX/TCL/395102

This graph shows: actual toll charges (green area), the theoretical toll (dotted line) with an inflator of 1% per quarter = 4.06% pa and the all group CPI weighted for 8 capital cities (dark blue line) as calculated by the Australian Bureau of Statistics
http://www.abs.gov.au/AUSSTATS/abs@.nsf/DetailsPage/6401.0Jun%202013?OpenDocument
In 2000, 10% (GST) and in 2013 after the widening an extra 7.7% was added. It can be clearly seen that tolls are far above the CPI and therefore inflationary.

The same holds true for the average cost per trip (RHS, red line) which has increased more than the CPI (LHS, dark blue line). On the graph, the CPI index has been scaled in such a way that both lines start at the same point in the June 2008 quarter. The dotted line represents a 1% per quarter increase as outlined in chapter 8.6 on tolls in this document on contracts:
Conclusion:
Sydney’s car traffic is largely a result of bad State-, town- and transport planning. Long distances between residential suburbs and employment centres, especially to/from around the CBD as well as a lack of decentralisation of urban development to regional centres outside Sydney’s commuting distance have created unsustainable traffic volumes. This post has shown how expensive this has become.
And Sydney is lucky that the high AUD has so far protected Australia from much higher petrol and diesel prices. Moreover, US shale oil has, for the time being, rescued the world from a deep oil crisis. So Australian toll-way operators have escaped the worst up to now. But with a weak Western economy in a period of triple digit oil prices it is doubtful whether the willingness to pay tolls will evolve as assumed in the original M2 project documents. And as the global debt crisis is hanging around for the foreseeable future, an additional risk will be how to continue rolling-over toll-way debt in the next years. It will be interesting to watch both traffic volumes and petrol prices as the government seems to be determined to continue its risky motorway strategy, not having learned the lessons form 4 Australian road tunnels which have already ended in receivership.
Related posts
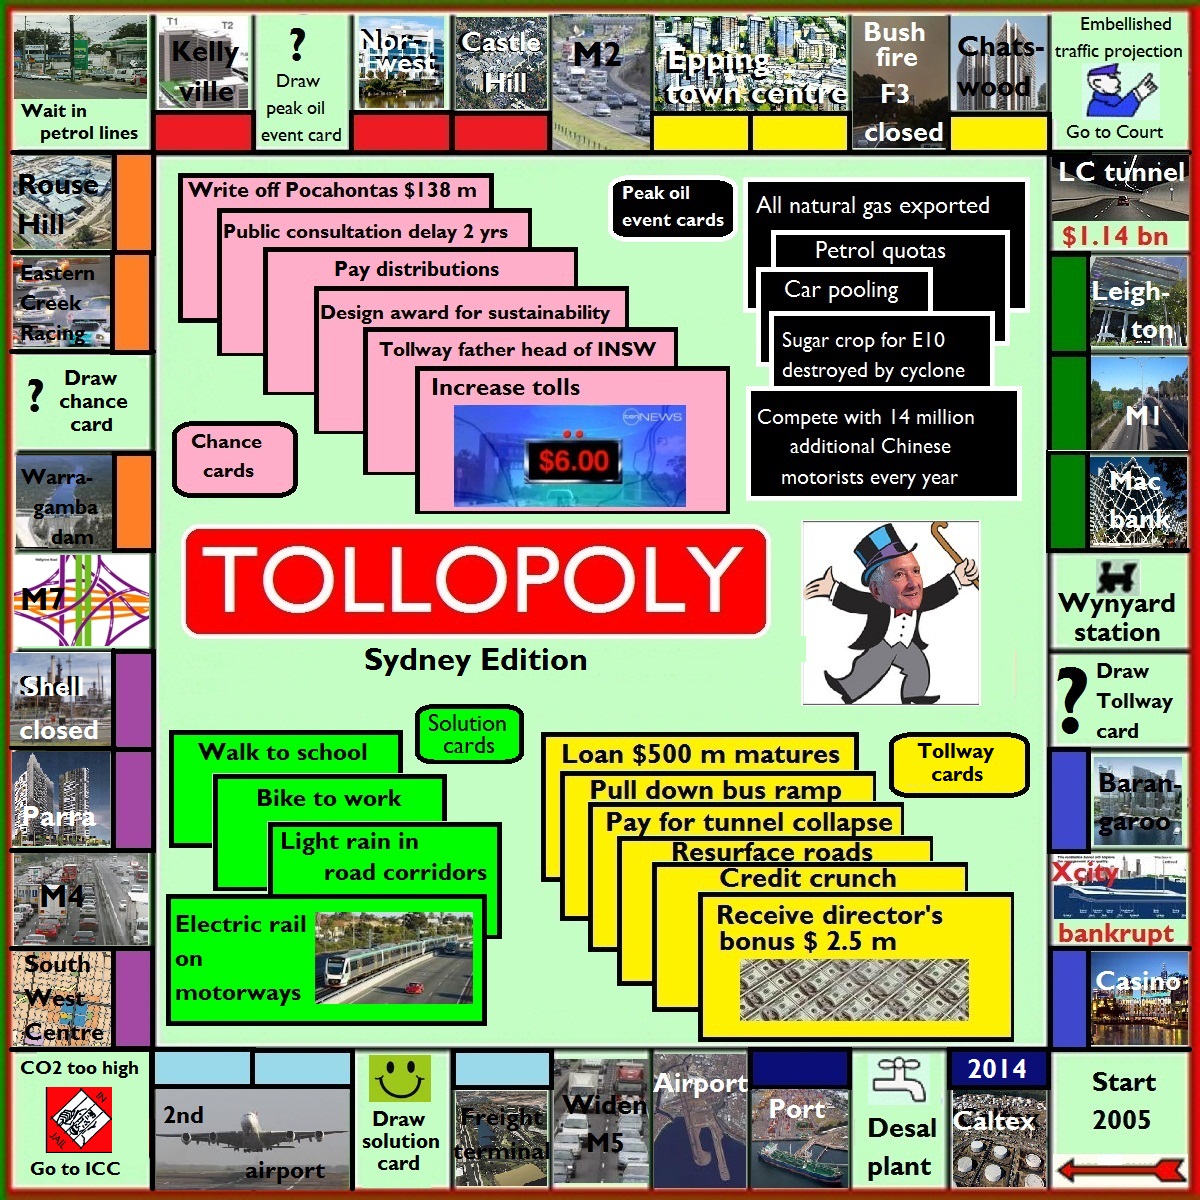
Tollopoly
http://crudeoilpeak.info/wp-content/uploads/2013/01/Tollopoly.jpg
14/8/2012
Transurban does not pay back its debt
http://crudeoilpeak.info/transurban-does-not-pay-back-its-debt
5/1/2011
Sydney’s M2 toll increase high above RBA inflation target (part 3)
http://crudeoilpeak.info/sydney%e2%80%99s-m2-toll-increase-high-above-rba-inflation-target-part-3
9/11/2010
M2 widening increases Sydney’s oil vulnerability
http://crudeoilpeak.info/m2-widening-increases-sydney%E2%80%99s-oil-vulnerability
28/10/2010
Quick risk analysis for M2 widening (Part2)
http://crudeoilpeak.info/quick-risk-analysis-for-m2-widening-part-2
21/9/2010
RTA fails to present business case for M2 widening (part 1)
http://crudeoilpeak.info/rta-fails-to-present-business-case-for-m2-widening-part-1